
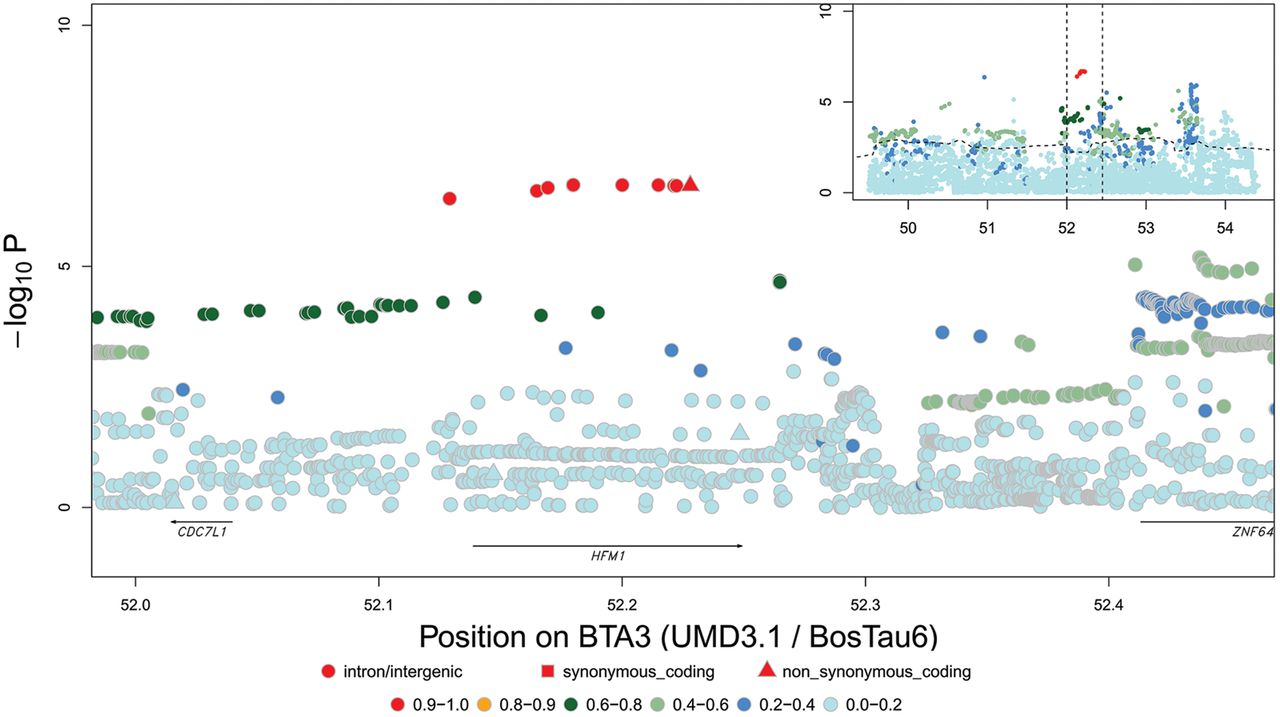
Figure 2.
Fine-mapping QTL for GRR by sequence-based association analysis for BTA3 QTL (52.40 Mb) in females. Variants are colored according to their LD with the lead variant. The variants in red define “LD-based set of candidate variants” assumed to encompass the causative variants. The dashed curve in the inset represents the significance of the haplotype-based association signal, while the dotted vertical lines define the boundaries of the region that is zoomed in on the main graph.


