
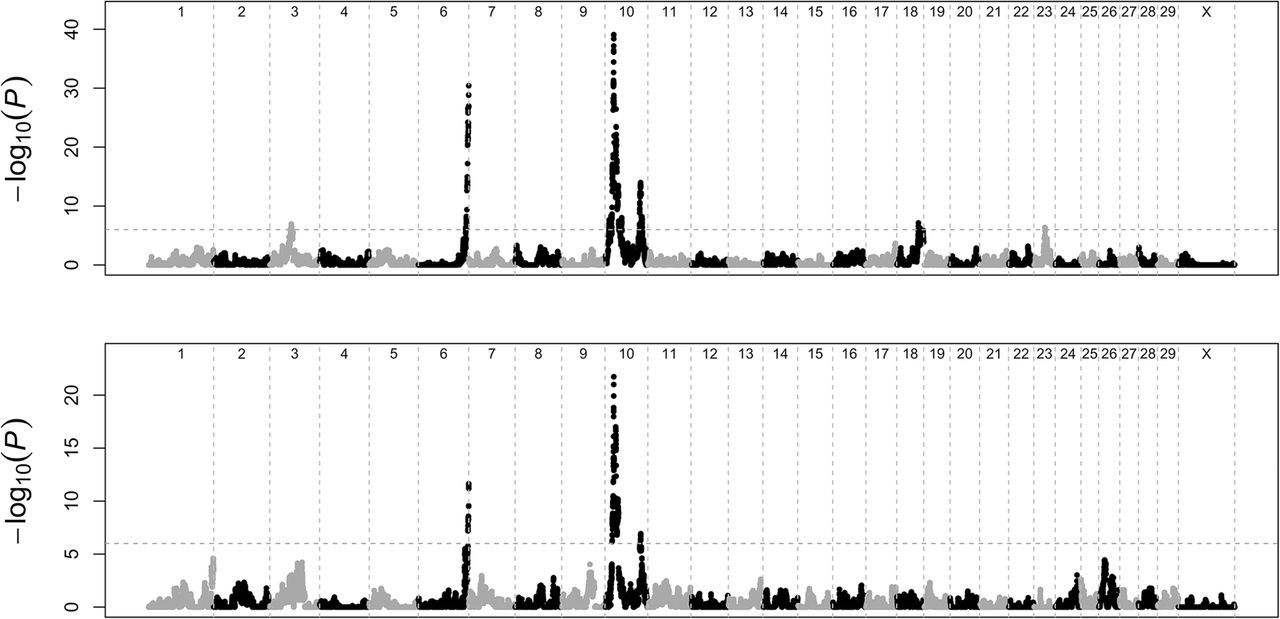
Figure 1.
Manhattan plots for male and female GRRs in cattle. The significance [−log10(P)] of the haplotype-based association is reported along the genome for male (upper panel) and female (lower panel) GRR. The horizontal dashed line marks the genome-wide significance threshold.


