
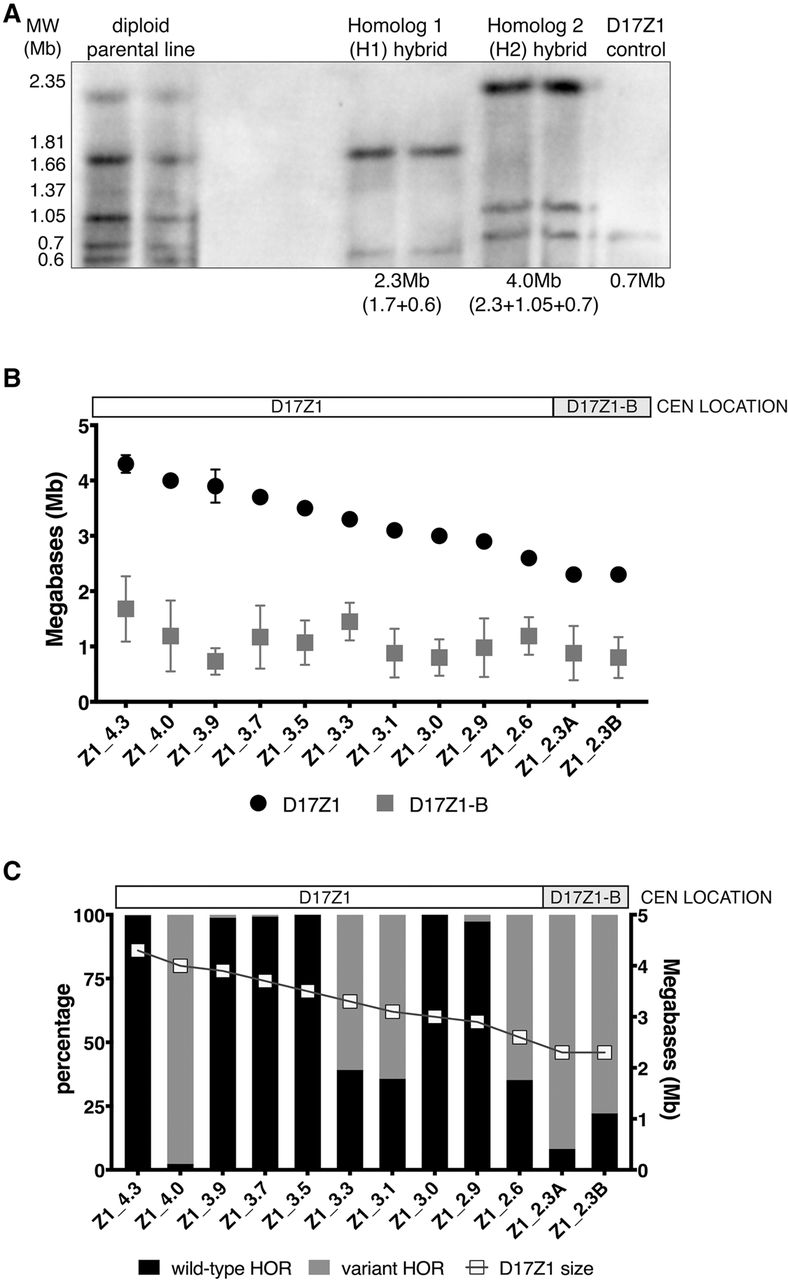
Larger D17Z1 arrays tend to be more homogeneous and are the site of centromere assembly. (A) Although the sizes of many D17Z1 arrays in our data set were already known (Maloney et al. 2012), D17Z1 arrays in new somatic cell hybrid lines were molecularly sized. D17Z1 array sizes were estimated using restriction digestion with enzymes that cut infrequently within the alpha satellite array, followed by resolution of large DNA fragments by pulsed field gel electrophoresis and Southern blotting. Representative Southern blot shows hybridization with a D17Z1-specific DNA probe p17H8. The parental diploid line shows many large DNA fragments from both HSA17 homologs. Individual HSA17 array sizes could only be resolved by moving each HSA17 homolog from the diploid line into the somatic cell hybrid background. Multiple bands were added to estimate the final array sizes. In this example, D17Z1 array size on Homolog 1 is 2.3 Mb and 4.0 Mb on H2. Each sample is shown in duplicate, along with a D17Z1 sizing control (0.7 Mb) for Southern blotting. (B) Because D17Z1-B is a relatively recently identified array, less is known about array size. We measured D17Z1-B array sizes on 12 different HSA17s using stretched DNA fibers and FISH with probes specific to D17Z1 and D17Z1-B (Supplemental Fig. S4). The size of D17Z1 was used as a normalizer to calculate D17Z1-B array size from fluorescent signals on DNA fibers; sizes of both arrays for individual HSA17s were plotted as shown. D17Z1 array sizes ranged from 2.3 to 4.3 Mb, while D17Z1-B sizes ranged from 0.7 to 1.6 Mb. The smaller D17Z1 arrays were associated with HSA17s in which D17Z1-B, not D17Z1, was the functional centromere. HSA17s are named and organized along the x-axis by D17Z1 array size (largest to smallest). Location of the centromere is denoted above the graph. (C) To investigate the correlation between array size and variation, D17Z1 array size and the proportion of wild-type and variant HORs (size + SNP) were plotted, revealing that inactive D17Z1 arrays have higher proportions (>80%) of variant HORs. Centromere location for each HSA17 is denoted above the plot. Z1_4.0 exhibited extensive D17Z1 variation but assembled the centromere at D17Z1. Z1_3.3, Z1_3.1, and Z1_2.6 exhibited moderate variation (∼60%) but still assembled the centromere at D17Z1.


