
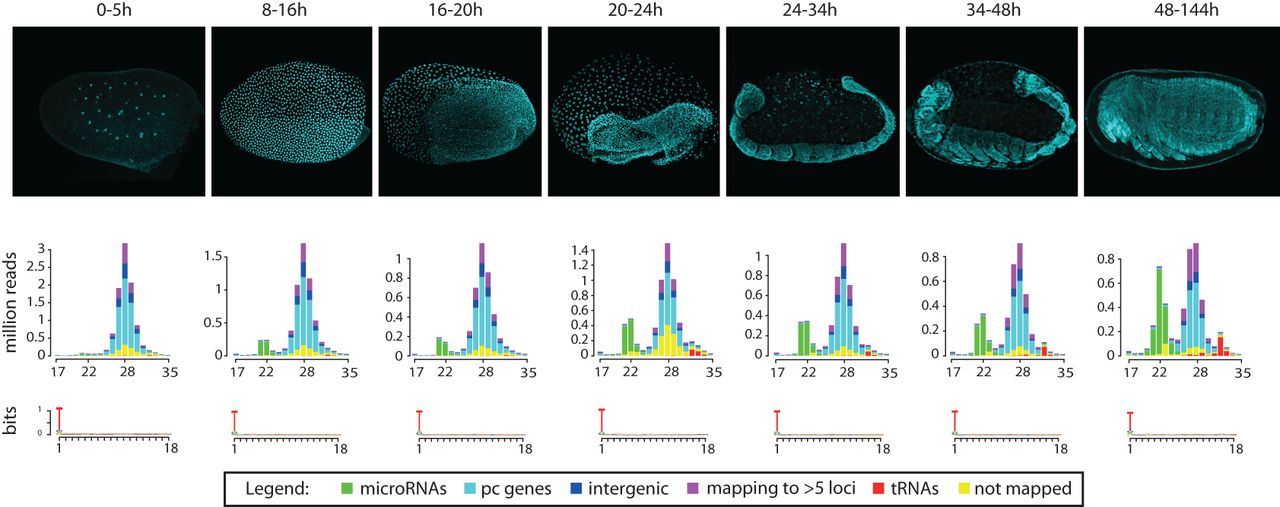
Figure 2.
Small RNA types and size distributions throughout T. castaneum development. Histograms show the small RNA size and count distribution in each small RNA library (DAPI-stained representative images for the corresponding time intervals are shown in the top panels). Different colors reflect read mapping status: (yellow) not mapped, (purple) mapping to >5 loci, or (red) mapping to at least one tRNA, (green) microRNA, (cyan) protein coding (pc) gene, or (blue) intergenic regions. Sequence logos show the nucleotide bias for the first 18 positions of reads.


