
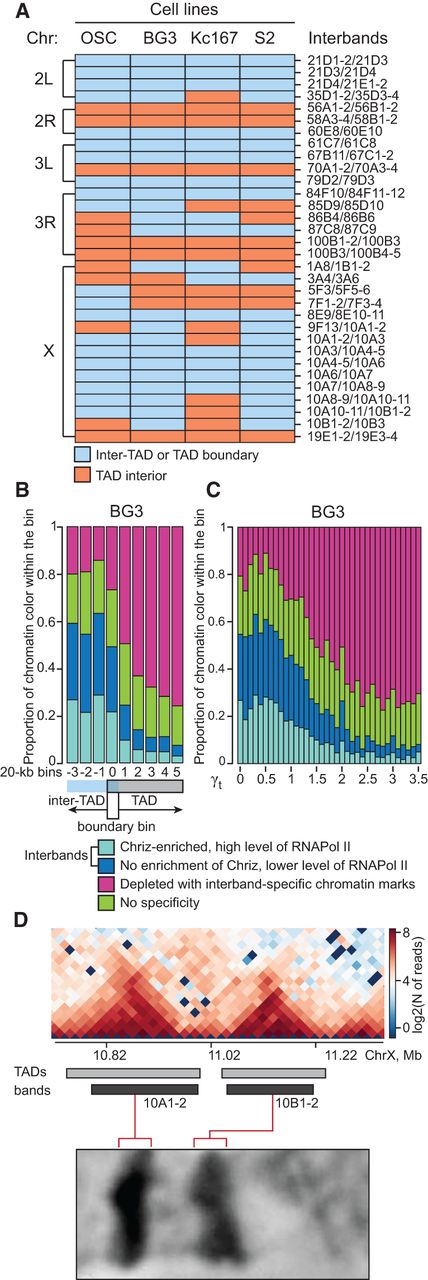
Inter-TADs correspond to polytene chromosome inter-bands. (A) Our annotation of TADs and inter-TADs at sites of 32 cytologically identified inter-bands (Zhimulev et al. 2014). (B) Distribution of inter-band-related chromatin colors (Zhimulev et al. 2014) near TAD boundaries. The alignment of bins relative to the TAD boundary bin is as in Figure 2B. The P-values are presented in Supplemental Table S6. (C) Bar plot showing the inverse dependence between the proportions of inter-band-specific chromatin colors within a genomic bin and γt. The P-values are presented in Supplemental Table S6. (D) Phase-contrast image of two bands clearly corresponding to TADs in the BG3 cells. Reprinted from Figure 4A from Vatolina et al. (2011) with permission from the publisher.


