
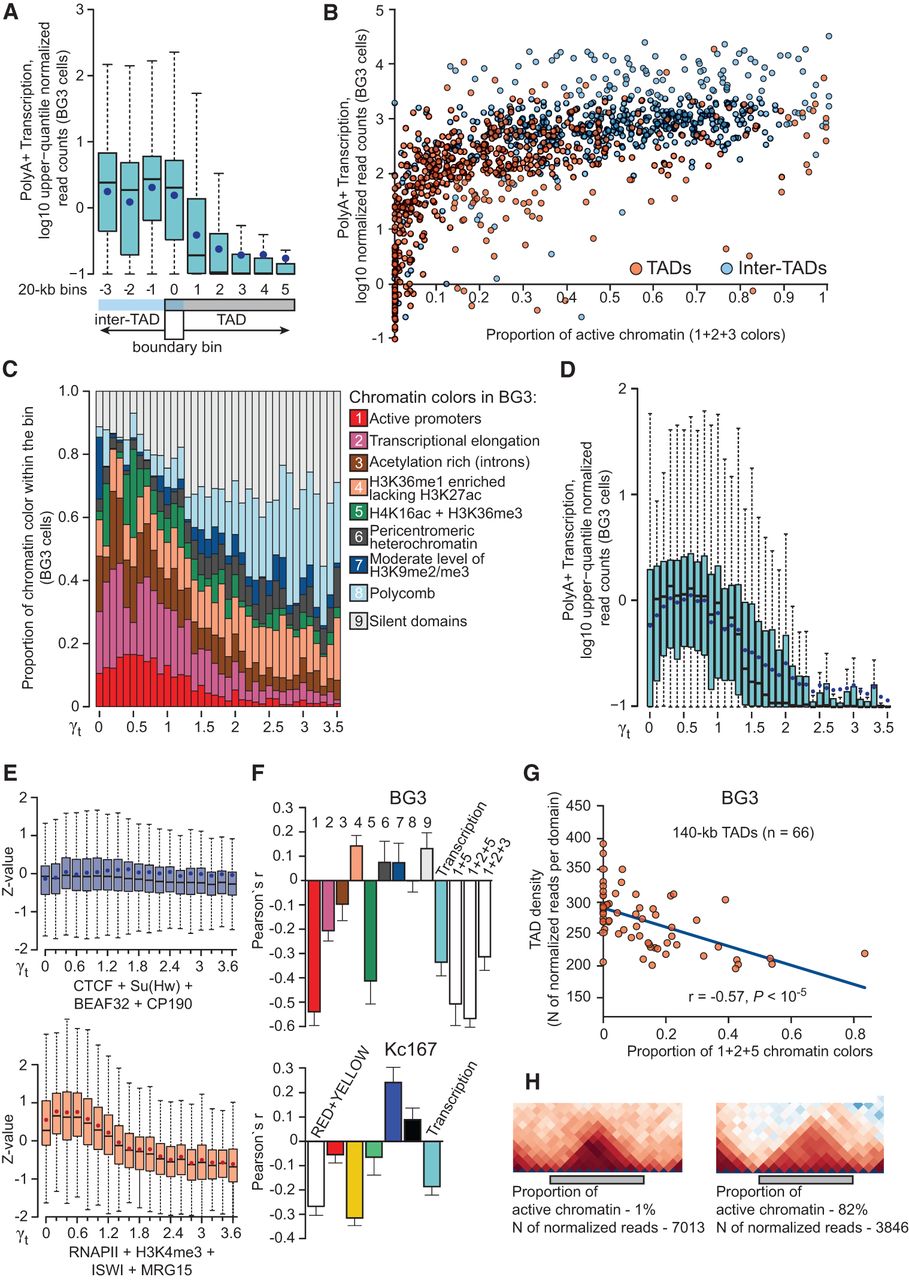
High transcription level and high content of active chromatin interfere with DNA packaging into TADs. (A) The level of poly(A)+ transcripts around TAD boundaries in the BG3 cells (data for the other cell lines are presented in Supplemental Fig. S8C). Box plots show the number of upper-quantile normalized transcriptome read counts over all bins located at the same position relative to a TAD boundary. Blue dots denote average values; medians are shown by thick black lines. (B) Scatter plot demonstrating the transcription level and fraction of active chromatin colors (sum of 1, 2, and 3 chromatin types) in individual TADs (excluding boundary bins) and inter-TADs (including TAD boundaries) in the BG3 cells. Data for the S2 and Kc167 cells are presented in Supplemental Figure S9. (C) Box plots showing inverse dependence between the proportion of active chromatin colors and γt (the minimal value of the scaling parameter γ required to annotate the bin as a TAD boundary or inter-TAD) in the BG3 cells. Average proportions of chromatin colors over all bins with the same γt are shown in each plot. Data for the S2 and Kc167 cells and similar diagrams built with γt ranging from 0 to 10 are shown in Supplemental Figure S5B. P-values are presented in Supplemental Table S6. (D) Box plots showing the inverse dependence between the transcription level within a genomic bin and γt in the BG3 cells. Data for the S2 and Kc167 cells are presented in Supplemental Figure S8D. (E) Box plots demonstrating the dependence between γt and the proportion of active chromatin marks (bottom) or the proportion of architectural proteins (top) in BG3 cells. (F) The Pearson correlation coefficients between the proportions of different chromatin colors (numbered as in C) or transcription level and the TAD density averaged over all size groups of TADs. Bar plots show the mean and variance values for the TAD size groups. (G) Scatter plot demonstrating the negative correlation between the TAD density and the proportion of active chromatin colors (sum of 1, 2, and 5 colors) (Kharchenko et al. 2011) for 140-kb-long TADs in the BG3 cell line. (H) A representative pair of TADs with different proportions of active chromatin display different TAD density.


