
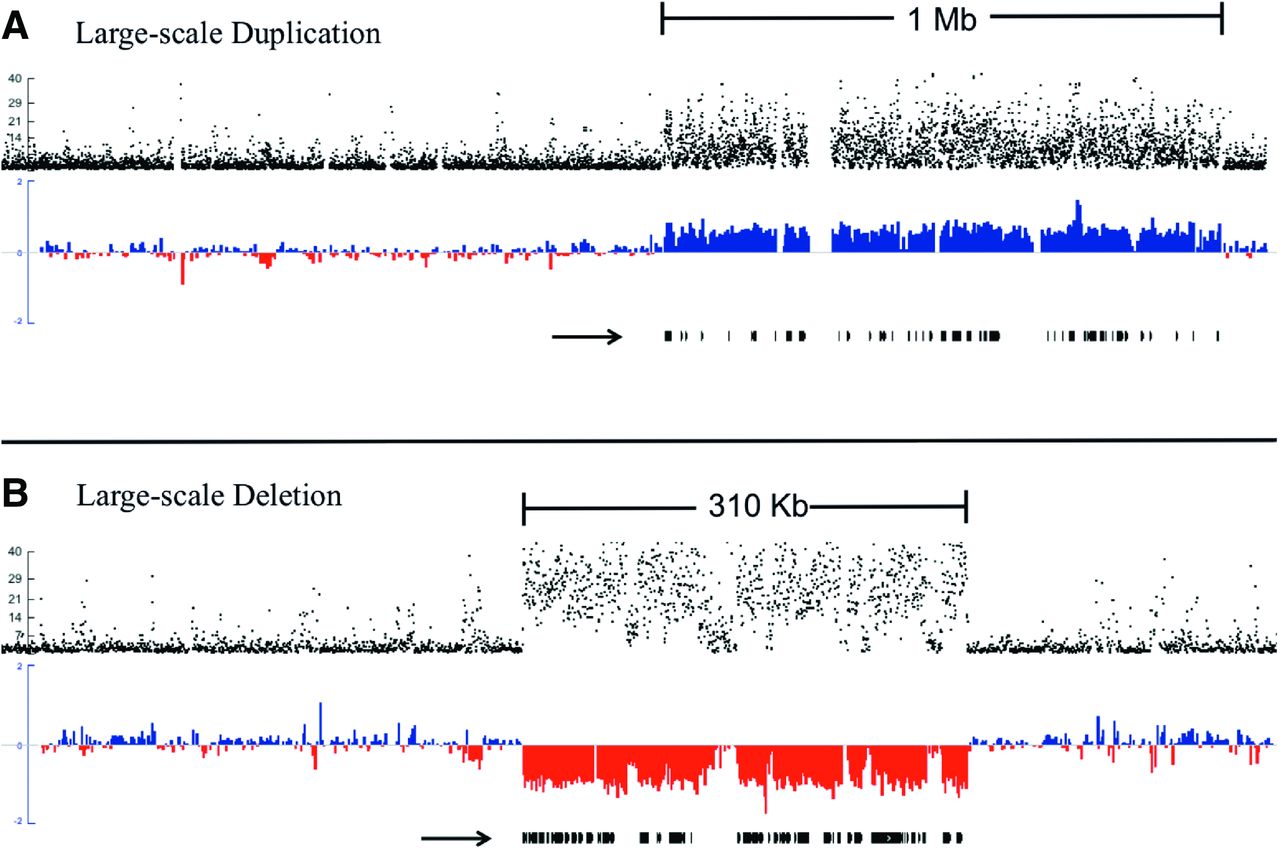
Large-scale duplication and deletion. (A) Large-scale duplication; (B) large-scale deletion. Black dots (top track on each figure) represent −log10P for each consecutive sliding window on scaffold 8 (A) and scaffold 17 (B) from the D. pulex reference assembly, where P denotes the probability the depth of sequencing coverage deviates from 1:1 by chance between the MA subline where the de novo CNV occurred and other sublines (see Methods). On the middle track in A (blue, duplication) and B (red, deletion), the normalized, log2 coverage ratio of the subline where the de novo CNV mutation versus a composite of the other three subline comparisons is plotted for both scaffolds in 500-bp windows, with sliding 250-bp increments (see Methods). The black arrow below the normalized coverage tracts denotes all D. pulex full-gene models nested within each duplication and deletion. Note that the separate scaffolds of these two events are not the same length, so the deletion (310 kb) and duplication (1 Mb) are not to scale. Large-scale CNVs were subsequently validated by RT-qPCR.


