
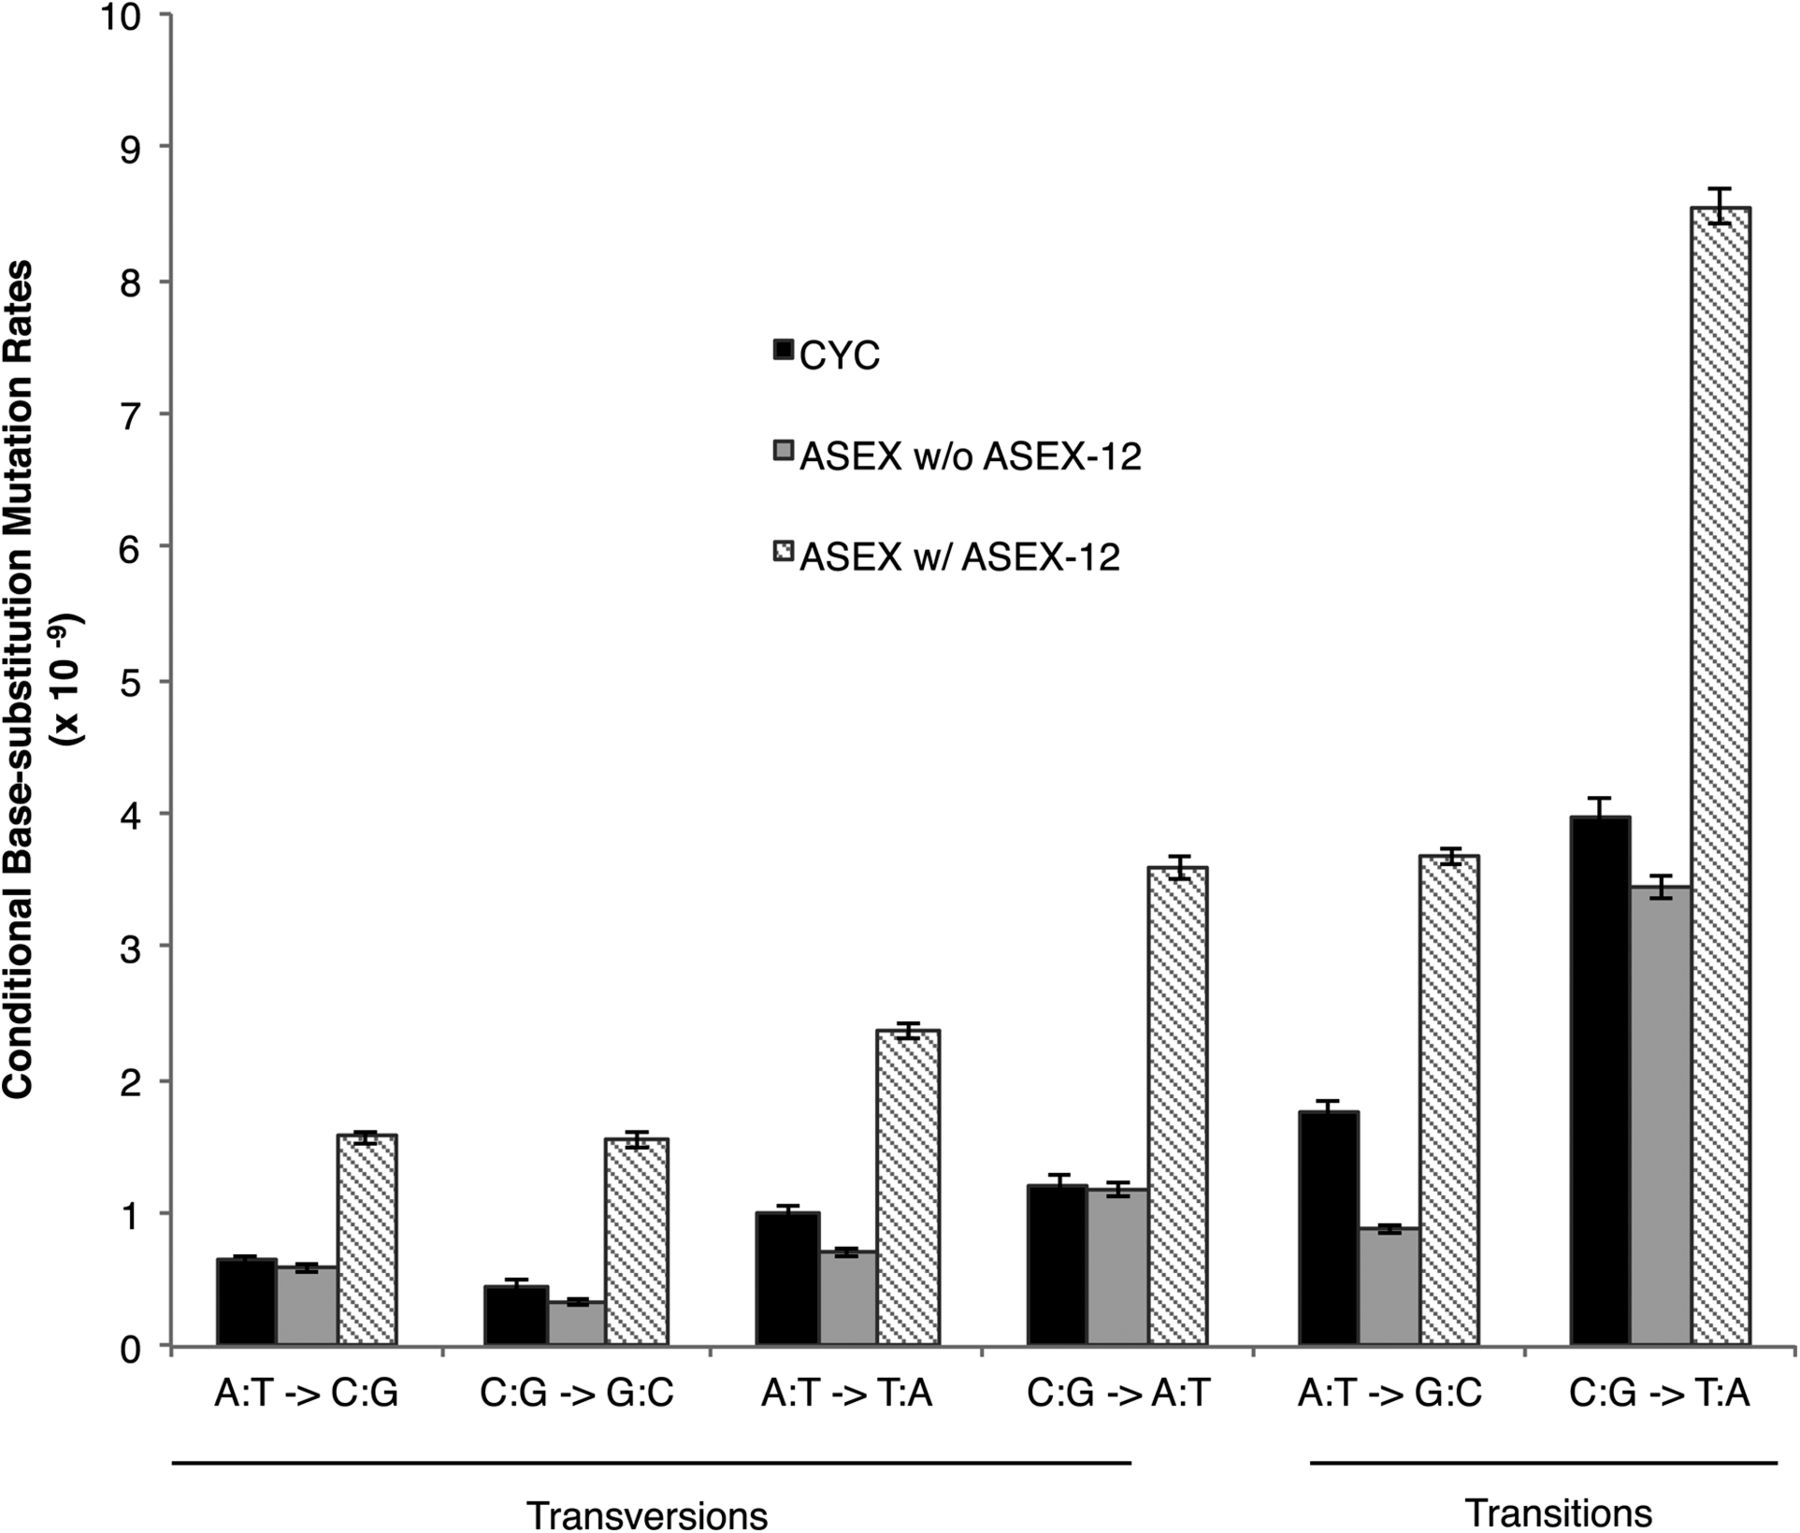
Figure 1.
Conditional base-substitution rates for both the ASEX and CYC experiments (per site per generation). For each type of base-substitution mutation, X → Y denotes the conditional mutation rate per site per generation (× 10−9, y-axis) from nucleotide X to Y.


