
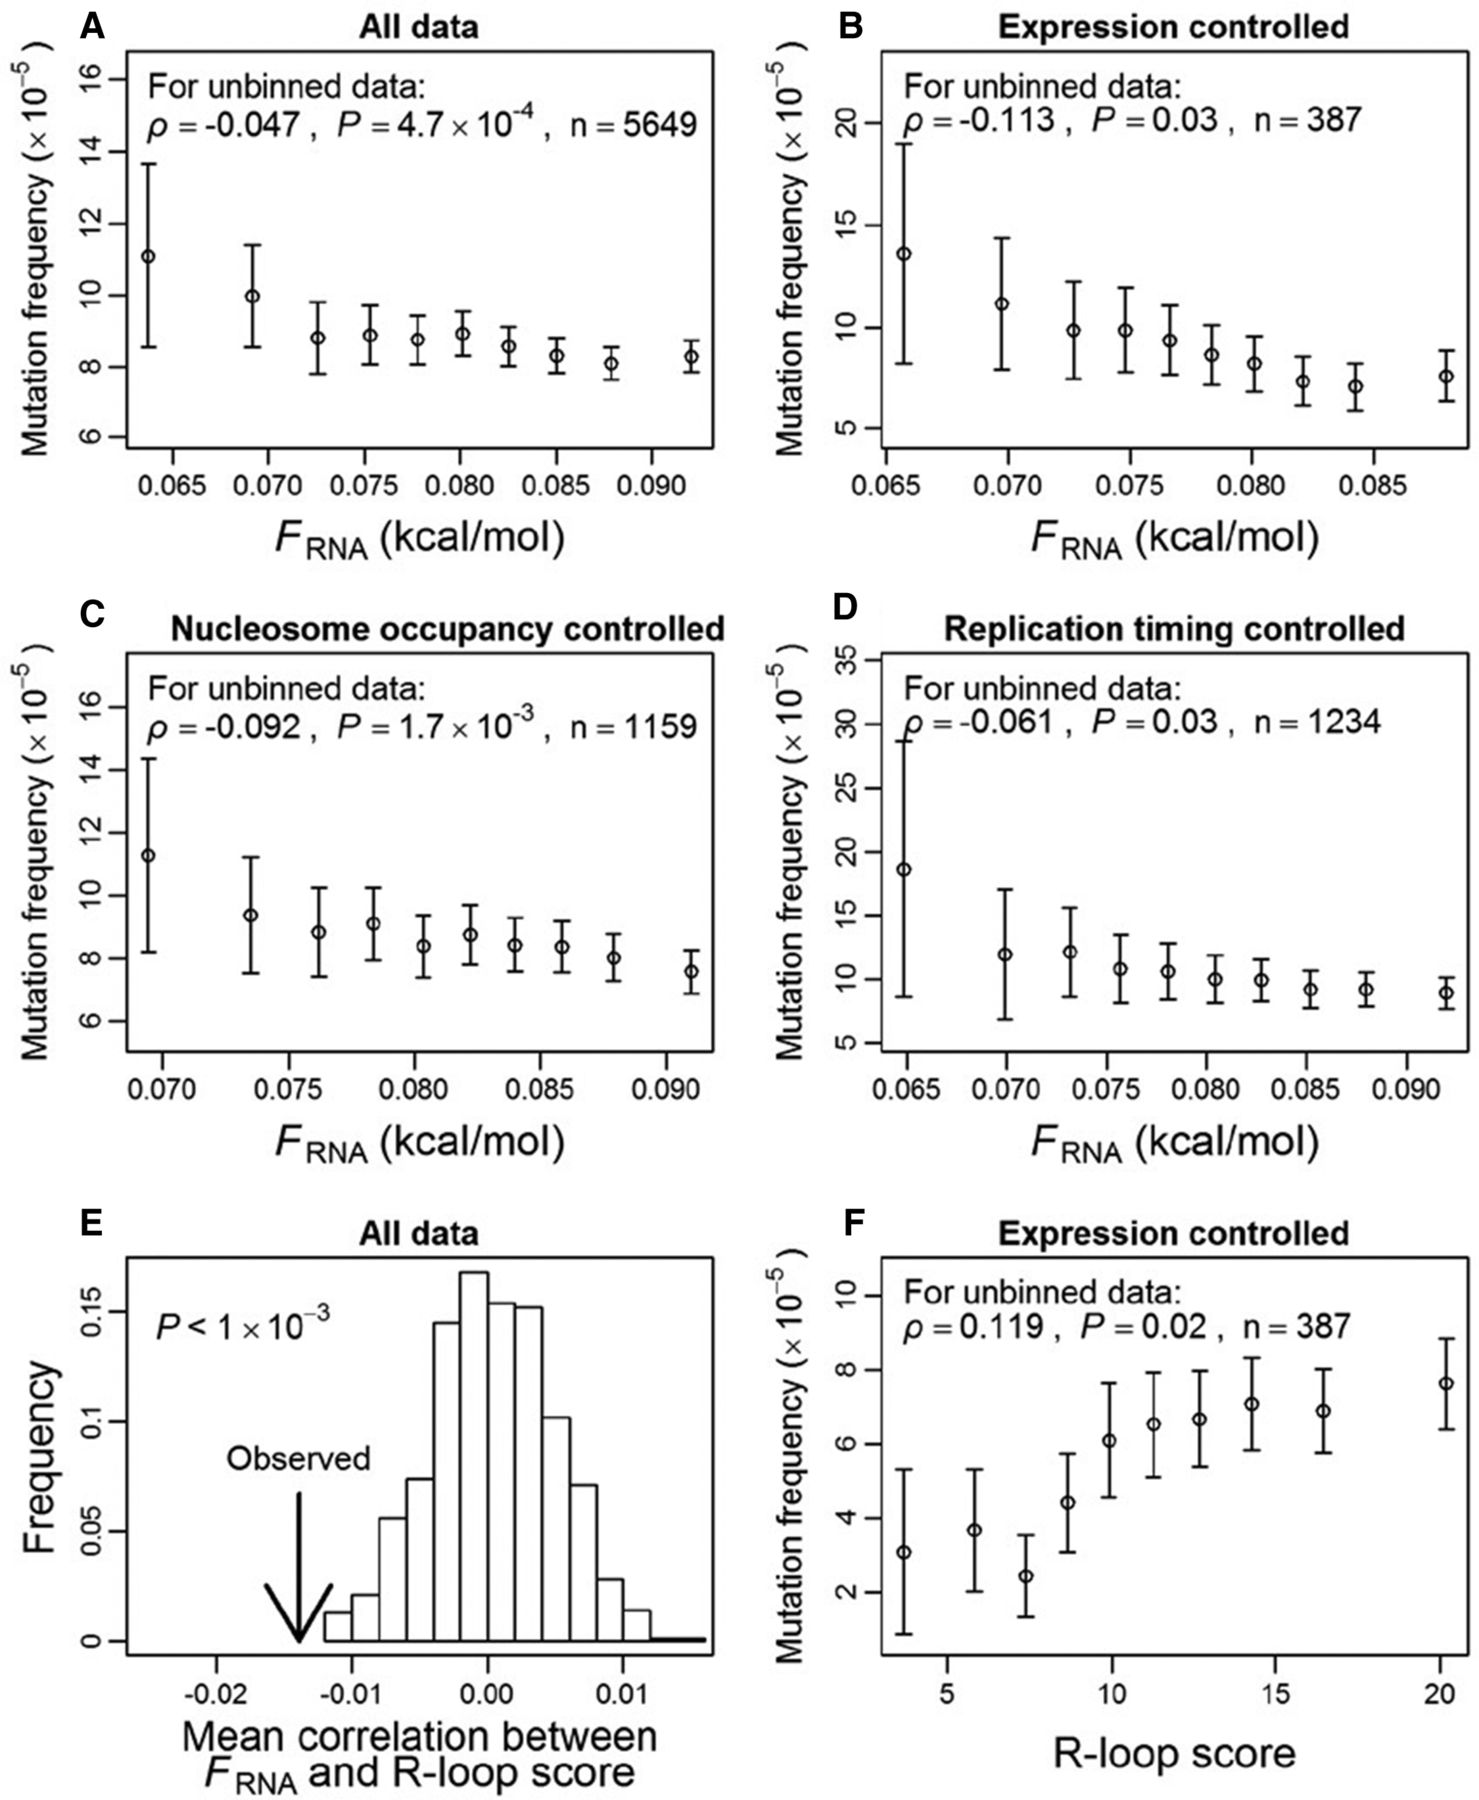
Genome-wide correlations among the mutation rate of a gene, its nascent RNA folding strength (FRNA), and R-loop score in yeast. For each gene, mutation rate per site is estimated from a set of mutation accumulation lines. (A) Mutation rate decreases with FRNA. (B) Mutation rate decreases with FRNA for the subset of genes whose expression levels are between 0.95 and 1.05 times the mean expression level of all genes. (C) Mutation rate decreases with FRNA for the subset of genes whose nucleosome occupancy levels are between 0.95 and 1.05 times the mean nucleosome occupancy level of all genes. (D) Mutation rate decreases with FRNA for the subset of genes whose replication timings are between −0.2 and 0.2 (in a standard normal distribution). (E) The among-gene average of the within-gene partial Pearson's correlation between FRNA and R-loop score after controlling for GC content is significantly more negative than the random expectation. The arrow indicates the actual observation, whereas the bars show the frequency distribution of the corresponding value derived from 1000 sets of genes with FRNA values randomly shuffled within genes. (F) Mutation rate increases with R-loop score for the subset of genes whose expression levels are between 0.95 and 1.05 times the mean expression level of all genes. In A–D, dots from left to right, respectively, contain the 10%, 20%, 30%, …, and 100% of genes with the lowest FRNA values. In F, dots from left to right, respectively, contain the 10%, 20%, 30%, …, and 100% of genes with the lowest R-loop scores. In all panels, error bars show one standard error.


