
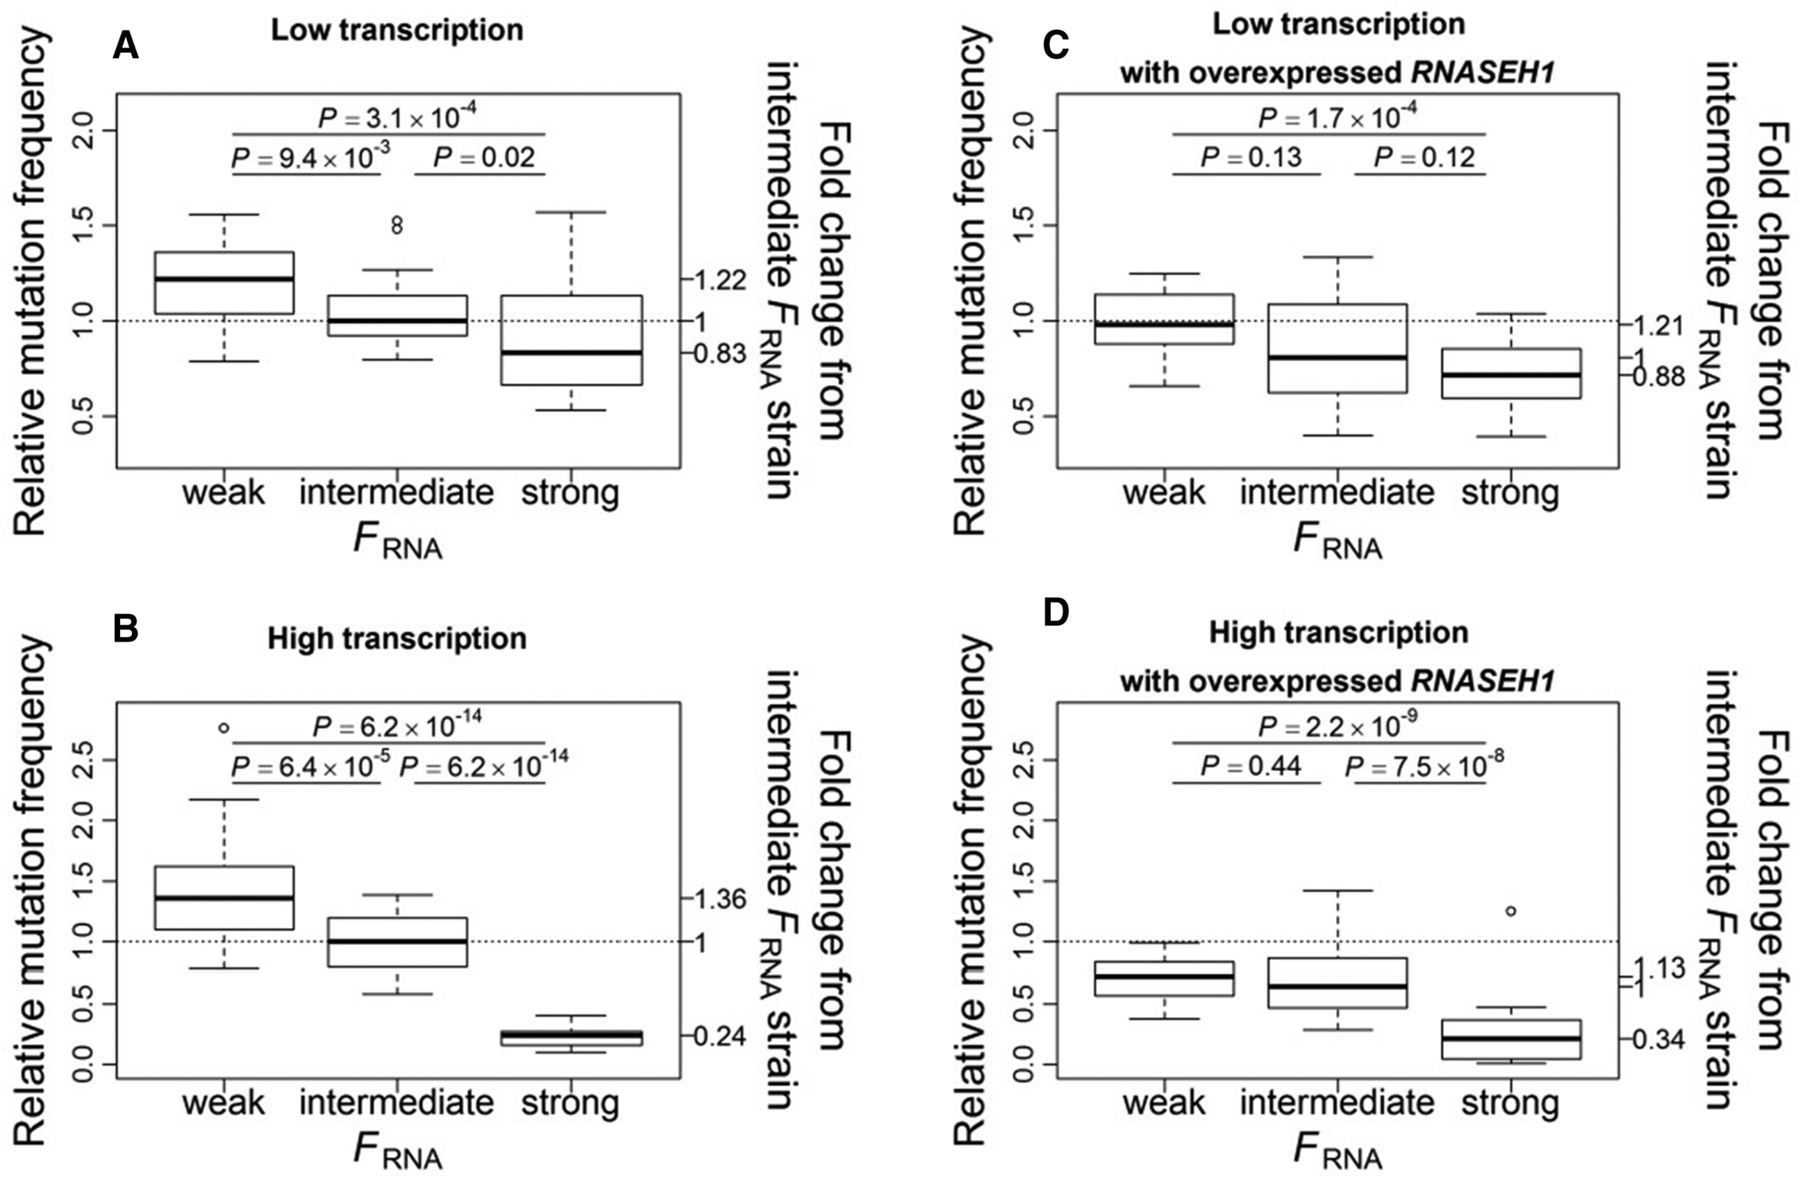
Null mutation frequency at CAN1 decreases with its nascent RNA folding strength (FRNA). The mutation frequency of a strain is presented relative to that of the strain with the same promoter and wild-type (i.e., intermediate FRNA) CAN1 without overexpressed RNASEH1 (dotted line). (A) Relative mutation frequencies in low-transcription strains (carrying the promoter pCAN). (B) Relative mutation frequencies in high-transcription strains (carrying the promoter pGAL). (C) Relative mutation frequencies in low-transcription strains with overexpressed RNASEH1. (D) Relative mutation frequencies in high-transcription strains with overexpressed RNASEH1. In each panel, the left y-axis shows the mutation frequency relative to the dotted line, whereas the right y-axis shows the mutation frequency relative to the wild-type CAN1 in the same panel. The bottom and top of each box are the first and third quartiles, and the band inside the box shows the median. The whiskers extend to the most extreme data point that is no more than 1.5 times the interquartile range from the box edges. Circles show outliers, which lie outside the range shown by the whiskers. P-values are based on Mann-Whitney U tests.


