
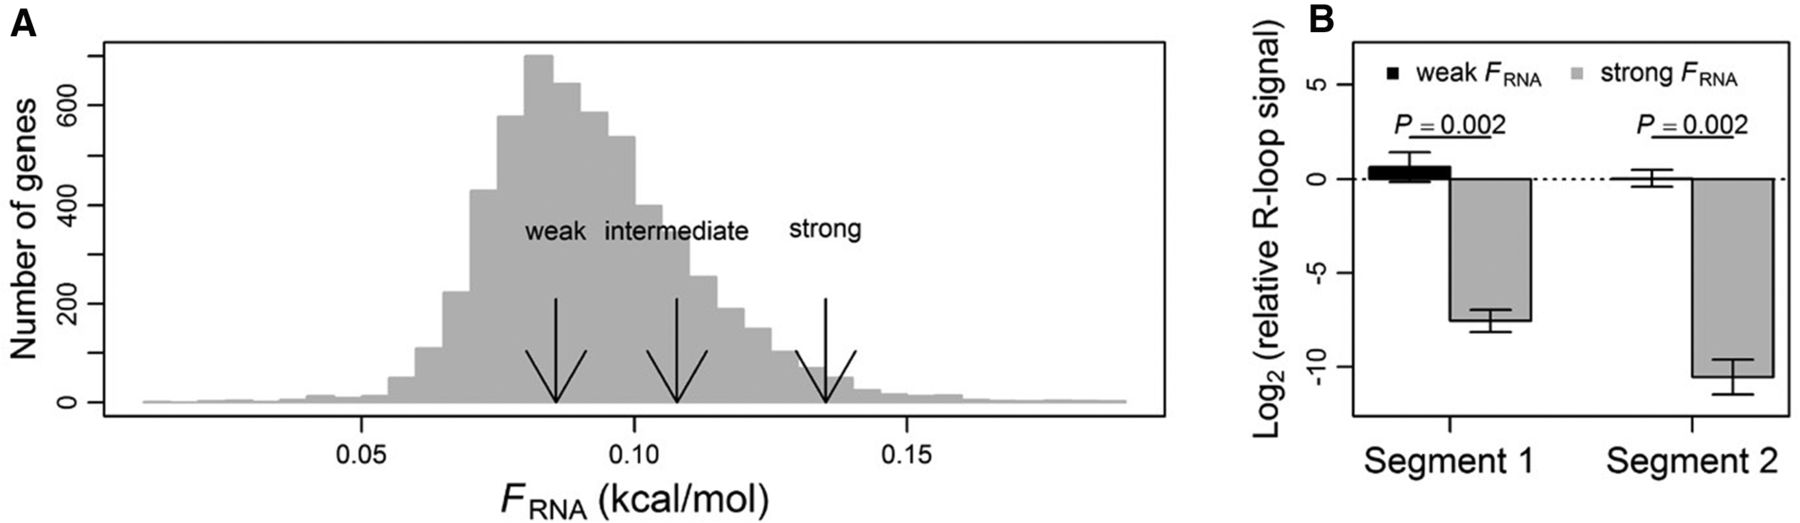
Predicted nascent RNA folding and measured R-loop signals for the three versions of CAN1. (A) Frequency distribution of the RNA folding strength (FRNA) of all yeast genes. The three versions of CAN1, with weak, intermediate (wild-type), and strong FRNA values, respectively, are indicated by arrows. FRNA is computationally predicted using sliding windows of 26 nt and then standardized to a per site value. Computational predictions based on other window sizes are shown in Supplemental Figure S2. (B) Experimentally determined R-loop signals, relative to that of ACT1, for the weak and strong FRNA versions of CAN1 in two probed segments. Error bars indicate standard error. P-values are based on two-tailed t-test.


