
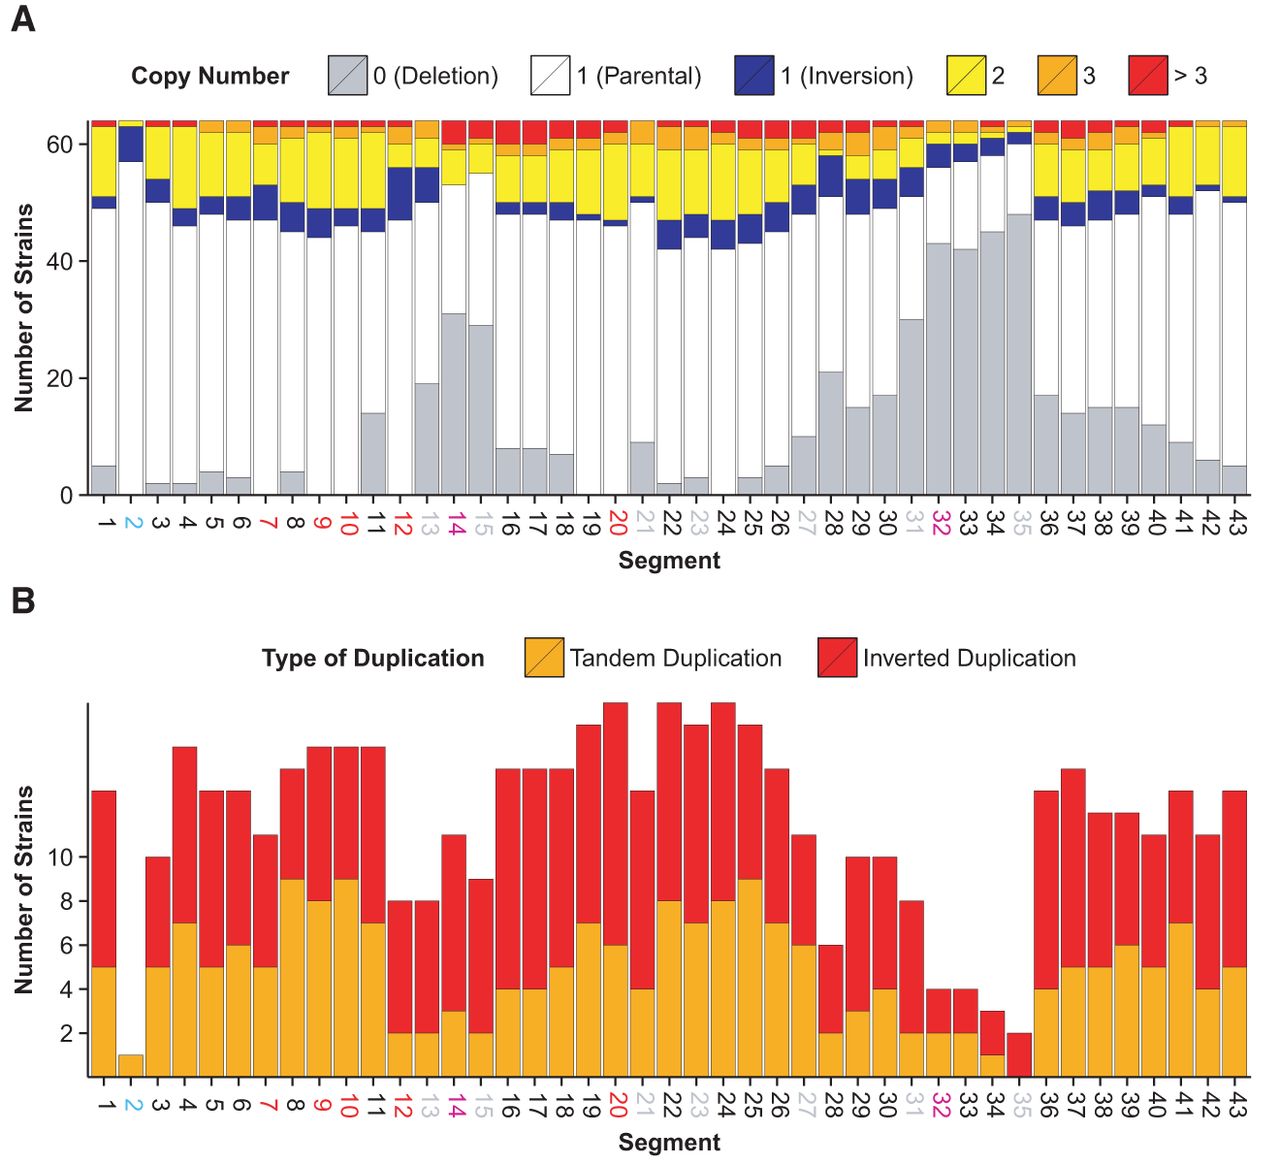
Figure 5.
(A) The distribution of copy number for each segment is shown across strains. (B) Each segment was involved in at least one duplication event.
(Downloading may take up to 30 seconds. If the slide opens in your browser, select File -> Save As to save it.)
Click on image to view larger version.
(A) The distribution of copy number for each segment is shown across strains. (B) Each segment was involved in at least one duplication event.
 CiteULike
 Delicious
 Digg
Digg Facebook
 Google+
 Reddit
 Twitter
