
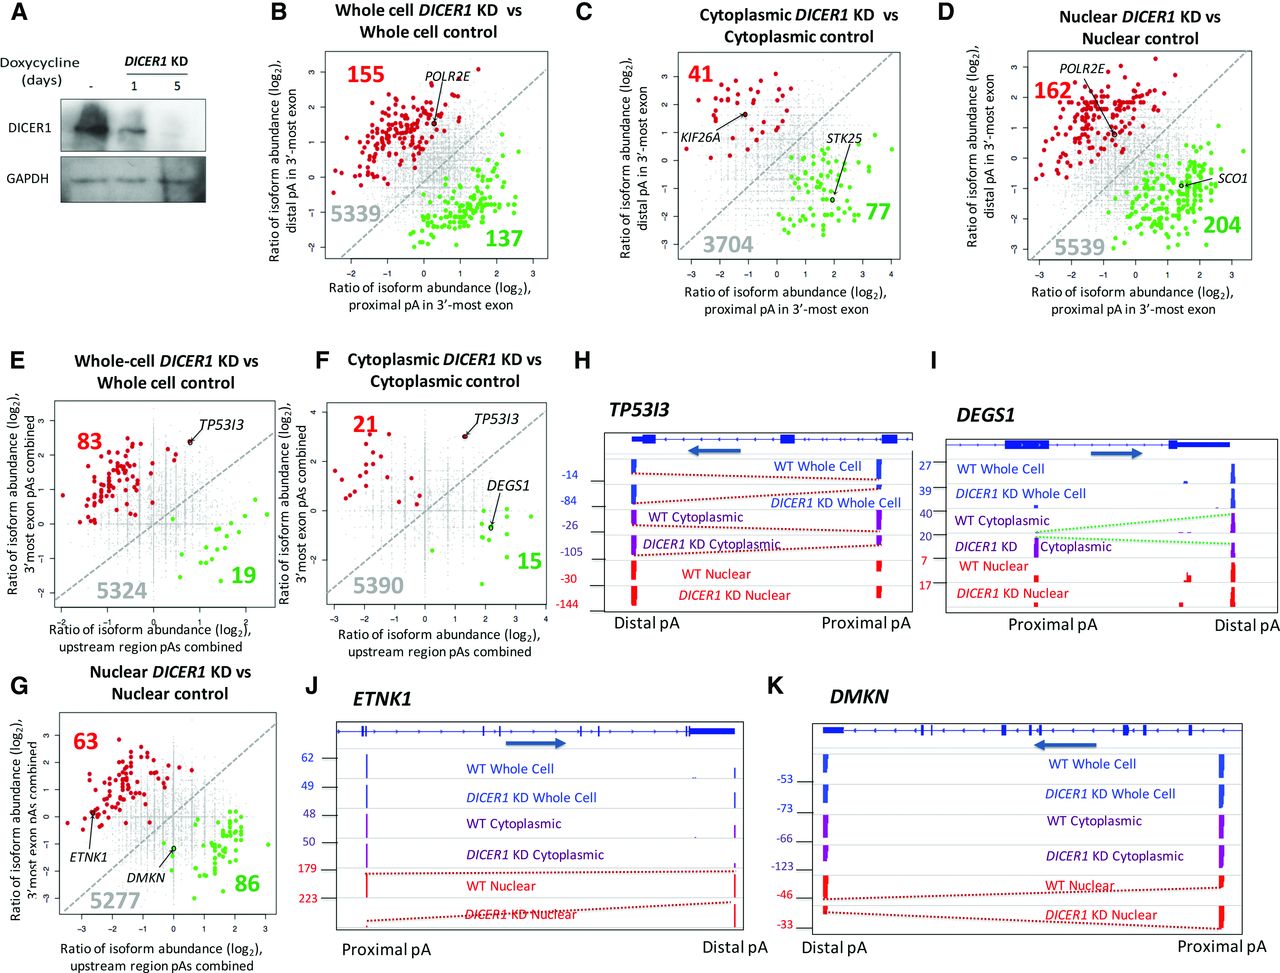
miRNA-based stability plays a minimal role in the differential regulation of APA isoforms. (A) Western blot showing depletion of endogenous DICER1 after a 5-d induction with doxycycline. GAPDH was used as a loading control. (B) Genes with 3′ UTR-APA that show either a significant shortening (green) or lengthening (red) of 3′ UTRs upon DICER1 KD when comparing whole-cell fractions. (C,D) As in B, but comparing cytoplasmic fractions (C) and nuclear fractions (D) in DICER1 KD cells relative to the equivalent control fractions. Screenshots of genes highlighted in scatter plots in B, C, and D are shown in Supplemental Figure 6. (E,F,G) As in B, C, and D but showing CR-APA rather than UTR-APA. (H) Screenshot of TP53I3, showing lengthening in the DICER1 KD cells when comparing both the cytoplasmic and whole-cell fractions. (I,J,K) As in H, showing DEGS1, ETNK1, and DMKN, respectively. DEGS1 shows shortening to the upstream CPA site compared to cytoplasmic fractions upon DICER1 KD. ETNK1 and DMKN show lengthening and shortening, respectively, when comparing the nuclear fractions of the DICER1 KD cells to the control cells. The positions of these genes on the scatter plots are highlighted.


