
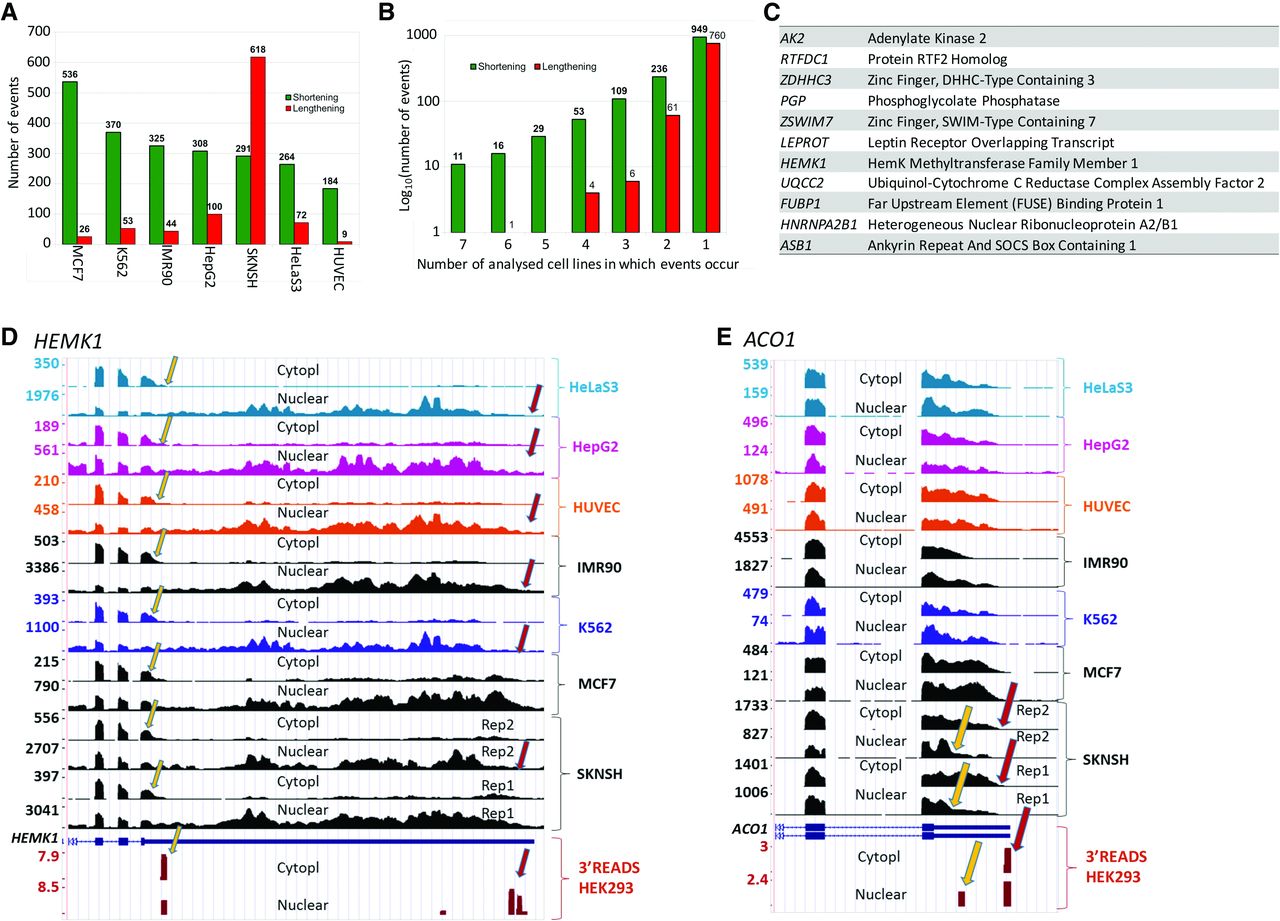
Differential representation of UTR-APA isoforms in subcellular RNA fractions using DaPars analysis. (A) Summary of the number of genes that show differential isoform representation in the subcellular fractions of seven different human cell lines using the DaPars algorithm. Green bars represent events in which there is a higher representation of the proximal APA isoform in the cytoplasm. Red bars show a higher representation of the distal APA isoform in the cytoplasm. (B) Analysis of the number of genes that show the same pattern of isoform representation across the different cell lines. Genes that show significant differential APA isoform representation using DaPars analysis were cross compared between cell lines. The number of events that occur in x number of cell lines were plotted on a log10 scale. Events in which the proximal APA isoform are overrepresented are shown in green, whereas events in which distal APA isoforms are overrepresented are shown in red. The absolute number of events is shown above each bar. (C) Identity of the 11 genes that show an overrepresentation of shorter APA isoforms in the cytoplasm in all seven cell lines. (D) Screenshot of the HEMK1 gene showing an overrepresentation of the shorter APA isoform in the cytoplasm in all cell lines. The yellow arrows indicate proximal sites, and red arrows indicate distal CPA sites. The bottom two tracks show confirmation of CPA sites from our 3′READS data and also show the same distribution of proximal and distal isoforms in HEK293 cells. (E) As in D, but showing an overrepresentation of the longer APA isoform in cytoplasm of the SKNSH cell line.


