
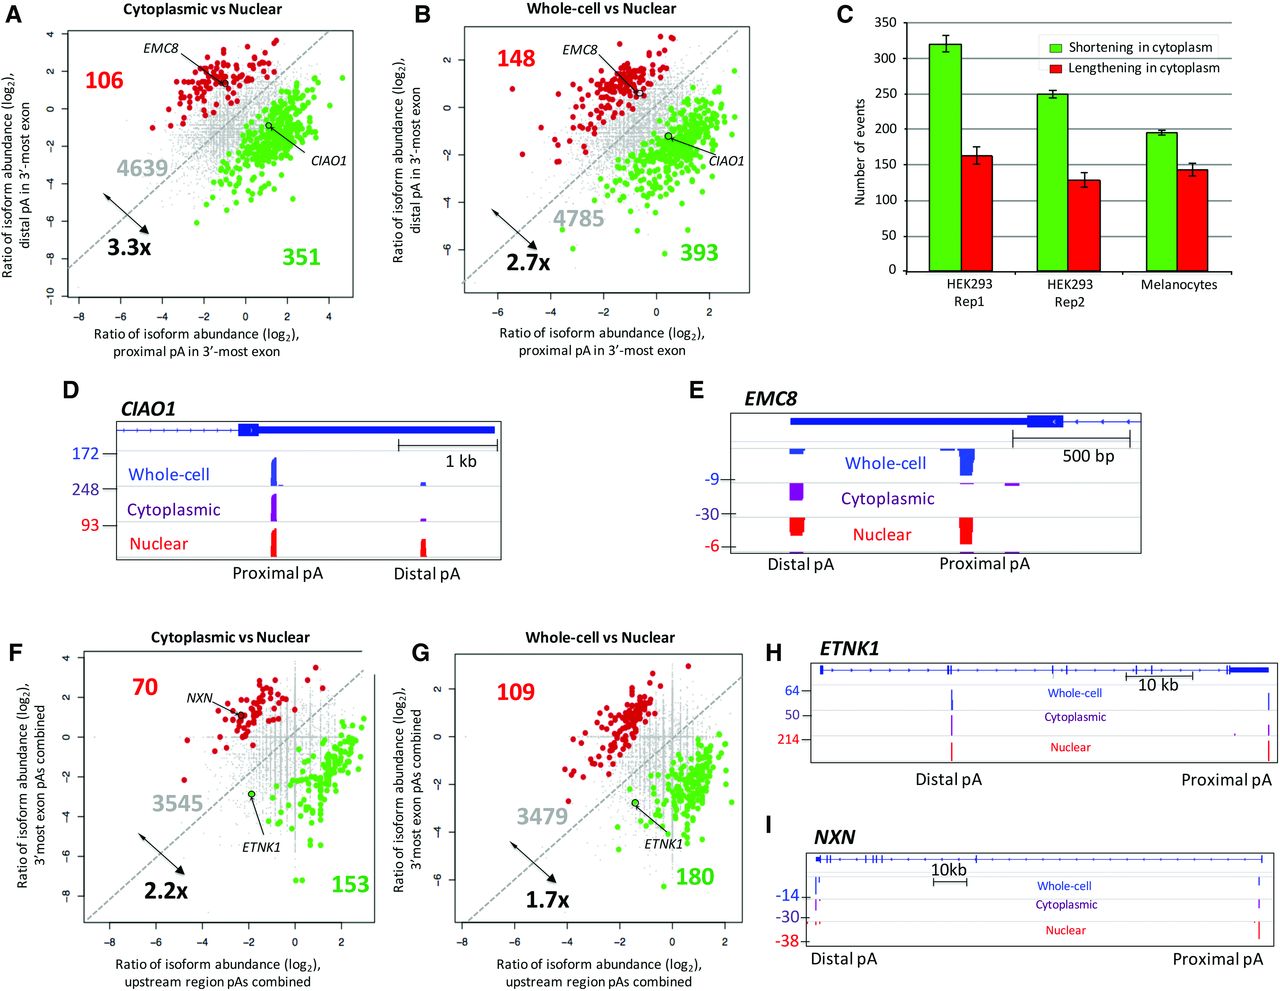
Differential representation of APA isoforms in subcellular RNA fractions using 3′READS. (A) Genes with 3′ UTR APA isoforms that differ significantly in relative representation of their two most highly expressed isoforms in the cytoplasm compared to the nucleus. Genes are highlighted when the shorter isoforms (green) or longer isoforms (red) have a significantly higher relative representation in the cytoplasm compared to the nucleus. Significantly regulated genes are those in which P ≤ 0.01 (Fisher's exact test) and the abundance change is >5%. (B) As in A, but comparing the whole-cell and nuclear APA profiles. (C) Number of genes showing significant difference in the cytoplasmic to nuclear fraction (C/N) ratio between proximal and distal CPAs in 3′ UTR based on the Significance Analysis of Alternative Polyadenylation (SAAP) method with FDR < 10%. The error bar is standard deviation based on 20 values. Green bars represent the number of genes showing a higher representation of proximal APA isoforms in the cytoplasmic fractions. Red bars represent the number of genes in which distal APA isoform is overrepresented in the cytoplasm. (D) Screenshot of CIAO1 as an example of a gene showing overrepresentation of its shorter isoform in both the cytoplasmic and whole-cell fractions relative to the nucleus. Read numbers are shown on the left, and proximal and distal CPA sites (pA) are as indicated. (E) As in D. EMC8 gene as an example showing overrepresentation of longer transcript in the cytoplasmic and whole-cell fractions. The positions of EMC8 and CIAO1 on the scatter plots are highlighted in A and B. (F) Genes with CR-APA, which significantly differ in their representation of upstream-region (intronic and exonic) APA isoforms relative to 3′-most-exon APA isoforms between the cytoplasmic and the nuclear fractions. Genes are highlighted when the upstream APA isoforms (green) or 3′ UTR isoforms (red) have a significantly higher relative representation in the cytoplasm compared to the nucleus. (G) As in F, but comparing whole-cell fraction relative to the nuclear fraction. (H) Screenshot of ETNK1 as an example of a gene that shows an overrepresentation of the upstream APA isoform in both the cytoplasmic and whole-cell fractions relative to nucleus. (I) As in H, the NXN gene is an example of overrepresentation of the longer transcript in the cytoplasmic fraction compared to the nuclear pool. Positions of ETNK1 and NXN on the scatter plots are highlighted.


