
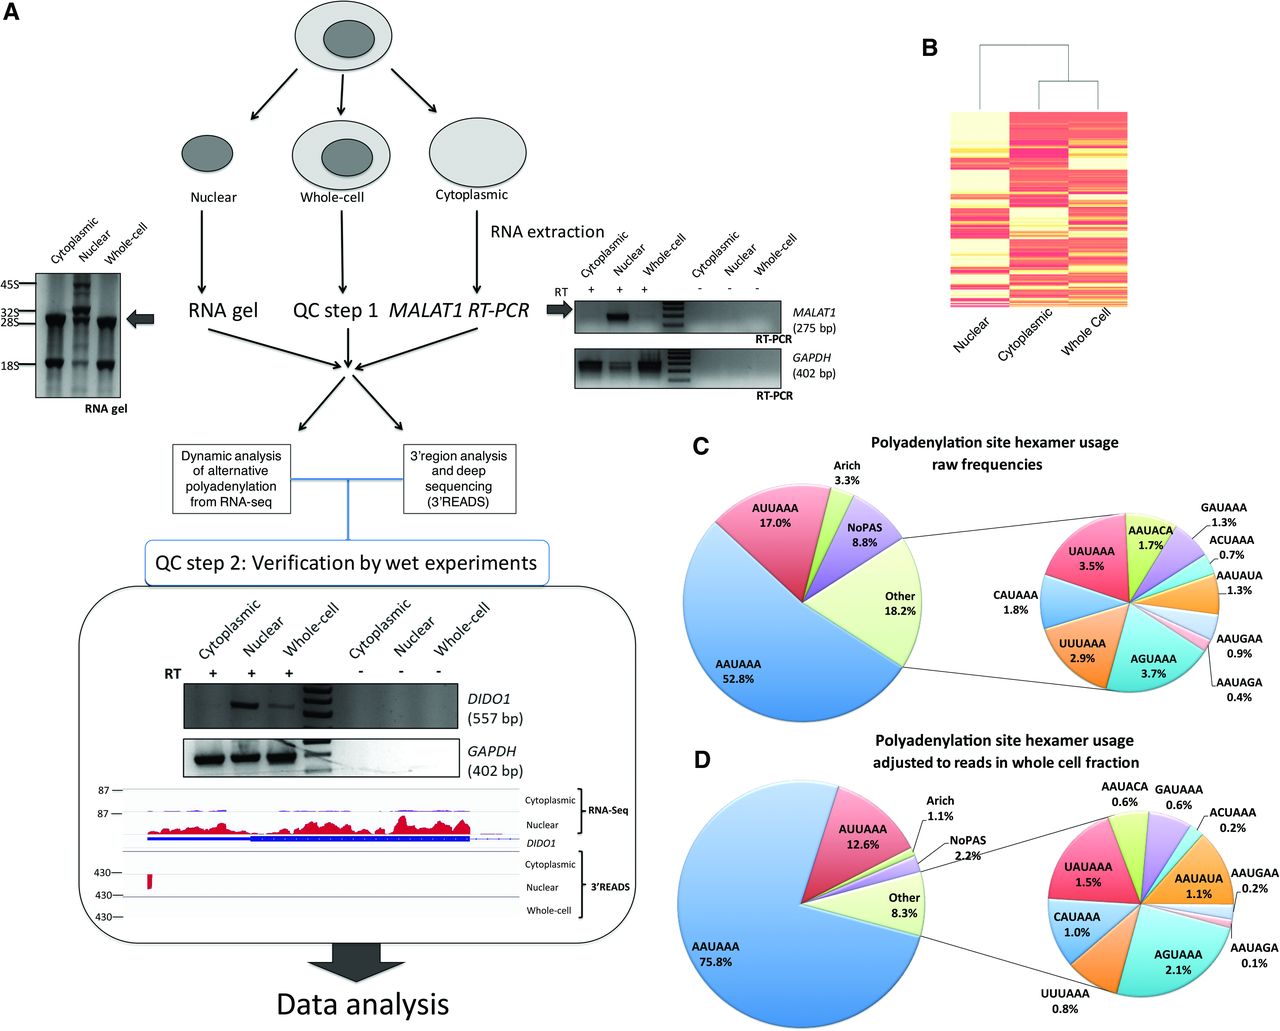
Subcellular fractionation-based APA analysis. (A) Schematic of the experimental approach showing the workflow and quality control steps. (Left) RNA gel and the enrichment of the precursor ribosomal RNAs in the nuclear fraction. (Right) RT-PCR of the nuclear marker MALAT1 and the GAPDH loading control. (Lower) Verification of the deep-sequencing step, confirming the subcellular distribution of DIDO1 as measured by 3′READS and RNA sequencing. (B) Heatmap and dendrogram plot showing similarity between subcellular fractions. (C) Polyadenylation signal (PAS) frequencies in the 0- to −40-nt region of all mapped cleavage and polyadenylation (CPA) sites. Here, only frequencies are taken into account, with all CPA sites considered equal, regardless of read number. (D) Read number–adjusted PAS frequencies, as in C, but with numbers reflecting reads over respective PAS in the whole-cell fraction of HEK293 cells.


