
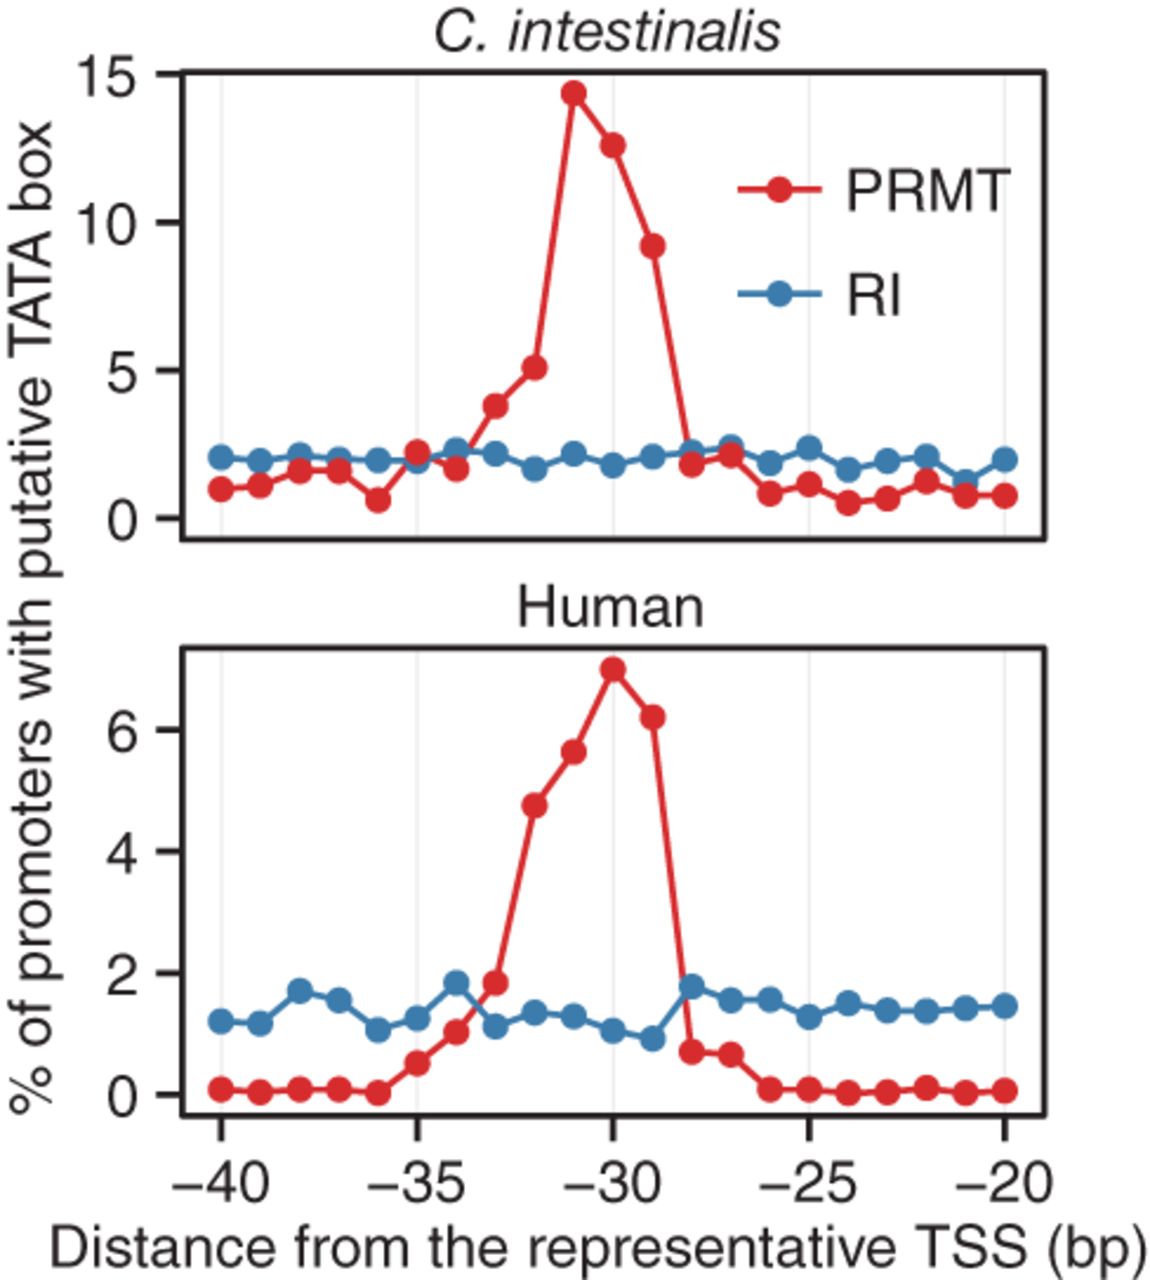
Figure 1.
Distribution of TATA boxes. The positions of putative TATA boxes were examined in core promoter regions. The x- and y-axes represent the distance from the representative TSS and the percentage of promoters with the putative TATA box at a given position, respectively. In addition to promoter sequences, the positions of putative TATA boxes in random intergenic regions are also shown (blue line). Intergenic regions (3000 and 6000) were randomly extracted from the C. intestinalis and human reference genomes, respectively. (PRMT) Promoter regions, (RI) random intergenic regions.


