
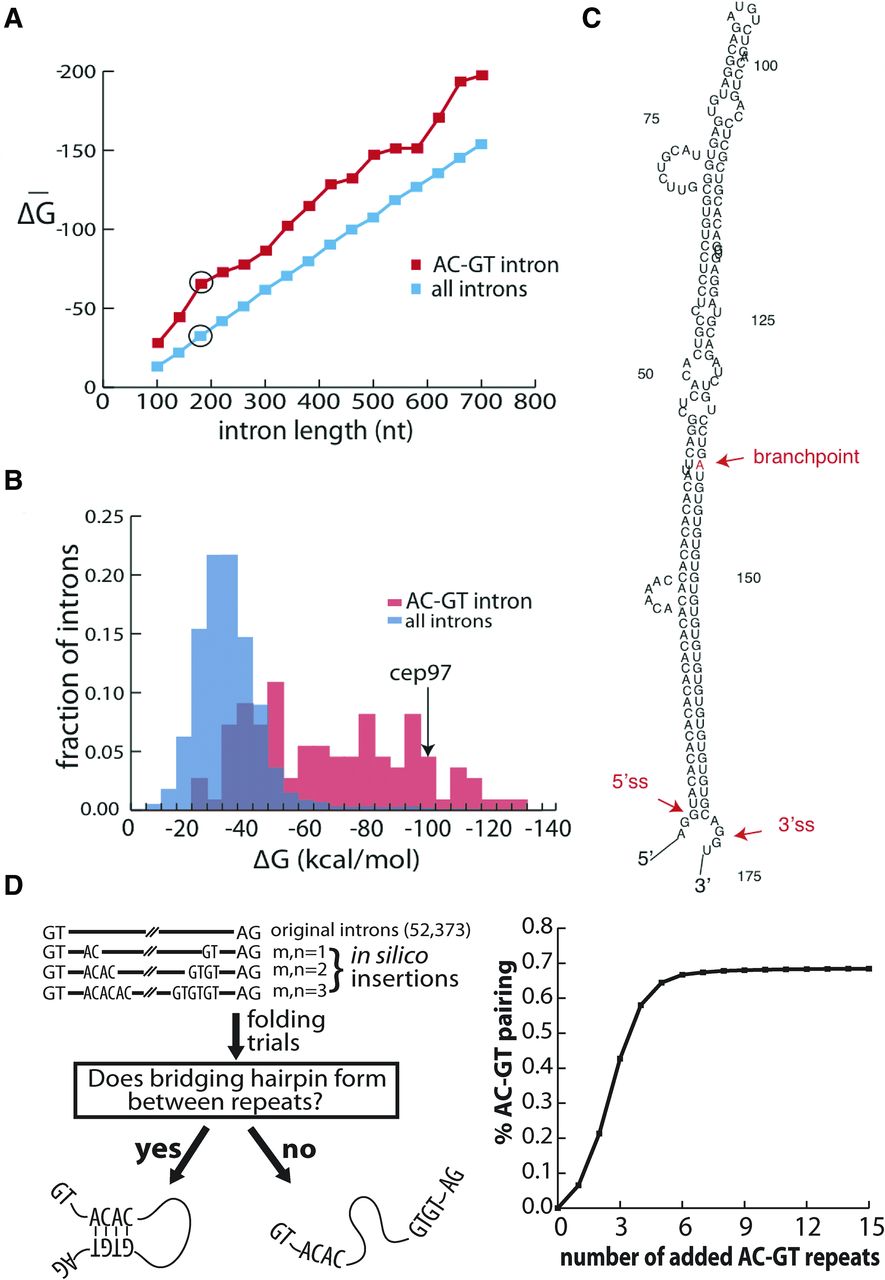
(AC)m-(GT)n introns represent a separate, structured class of introns in zebrafish. (A) Zebrafish introns are binned by length and folded by RNAfold. The average minimum free energy of folding for each bin is plotted for all introns and the subset of (AC)m-(GT)n introns defined by at least one occurrence of an AC and a GT repeat hexamer within 40 nt of the 5′ ss and 3′ ss, respectively. The 170-nt bin (circled) is expanded in B to show the distribution of the free energies of intron folding for the general population of introns (blue) and the (AC)m-(GT)n subclass (red). (C) The structure of an exemplar intron (intron 5 from cep97) was predicted and displayed by RNAfold. The 5′ ss, the 3′ ss, and the branchpoint site (determined experimentally by inverse PCR in vivo) are indicated with red arrows and text. (D) (AC)m-(GT)n repeat addition simulations in zebrafish introns demonstrating the effect of AC and GT repeats on intronic structure. (Left) Schematic for (AC)m-(GT)n repeat addition simulation. AC and GT dinucleotide repeats of varying length (0 ≤ m, n ≤ 20) were added 20 nt downstream from the 5′ ss and upstream of the 3′ ss. The repeats were determined to direct the overall structure if the upstream AC repeats base-paired to the downstream GT repeats forming a large hairpin. (Right) Simulation result. The percentage of introns in which the AC repeats base-paired to the GT repeats to form a hairpin structure was counted (y-axis) against the insertion of varying lengths of AC and GT repeats (x-axis). Resampling the data resulted in 95% confidence intervals of <1%.


