
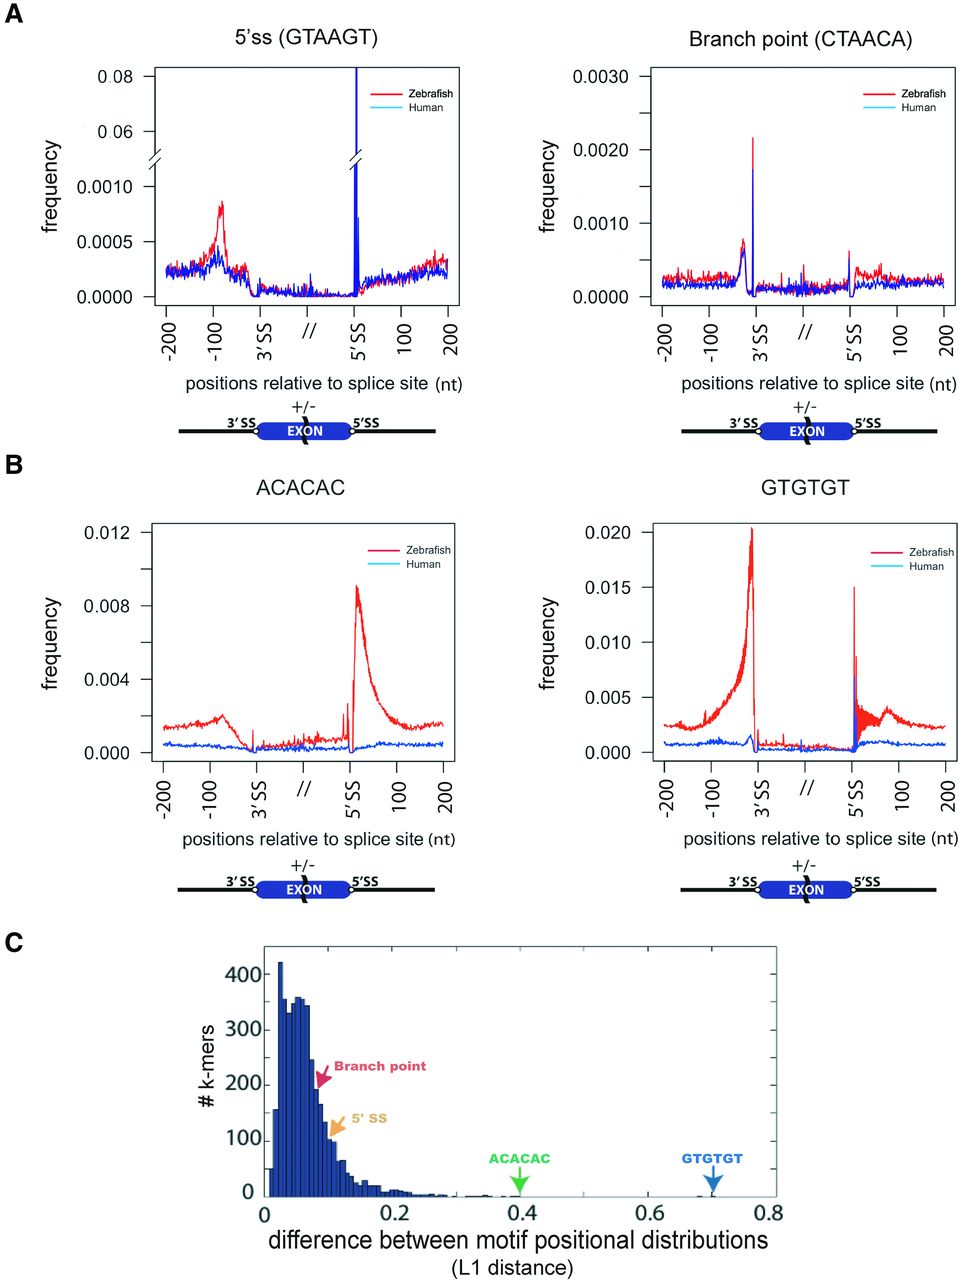
The distribution of AC and GT repeats shows the most extreme divergence between human and zebrafish. (A) Plot of frequency (y-axis) of 5′ ss and BP around all 3′ and 5′ ss in human (blue line) and zebrafish (red). The position plotted is −200 to +100 relative to 3′ ss (−200 to “//” of x-axis) and −100 to +200 relative to 5′ ss (“//” to 200 of x-axis). (B) Plot of the frequency (y-axis) of AC and GT repeat hexamers around all 3′ and 5′ ss in human (blue line) and zebrafish (red). (C) Differences of motif positional distributions (L1 distance) of all 4096 hexamers in human-zebrafish comparison. The distance is the sum of the difference (e.g., area between two lines in A and B) of normalized frequencies relative to splice sites. Green arrows show AC repeat hexamers (i.e., ACACAC and CACACA). Blue arrow shows GT repeat hexamers. Yellow and red arrows indicate 5′ ss and BP, respectively.


