
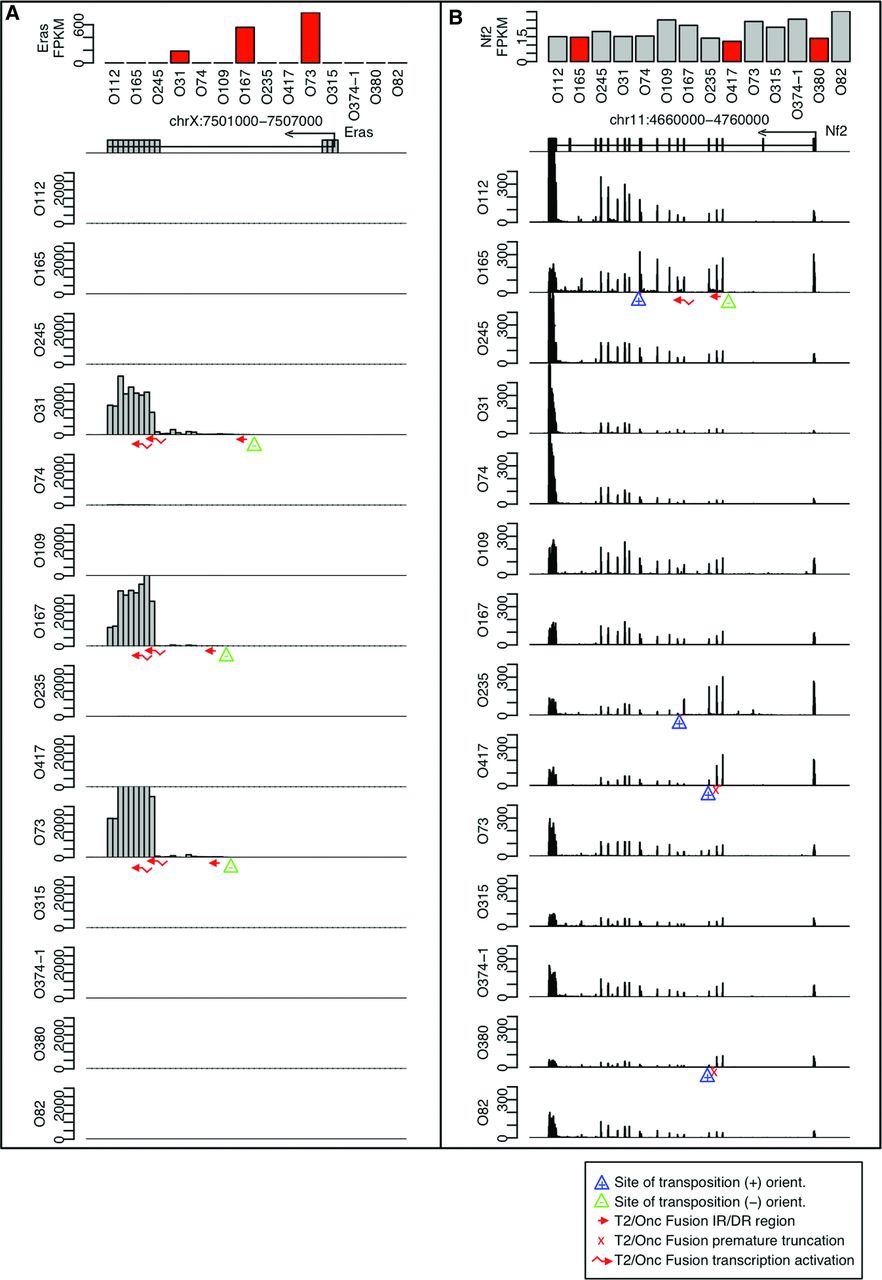
Transcription near CIS insertions. Image showing FPKM values for (A) Eras and (B) Nf2 for each of the 14 SB osteosarcoma (OS) tumors. An exon map of the gene region is shown indicating the direction of transcription below the FPKM bar plots. For each tumor, a histogram of the raw number of reads observed within each 100-bp window is shown. The locations of LM-PCR-identified insertions are shown with triangles. Blue triangles represent positive orientation insertions that can activate transcription on the + strand, while green triangles represent negative orientation insertions that can activate transcription on the − strand. RNA fusions identified in the RNA-seq data are described in the figure legend (bottom right).


