
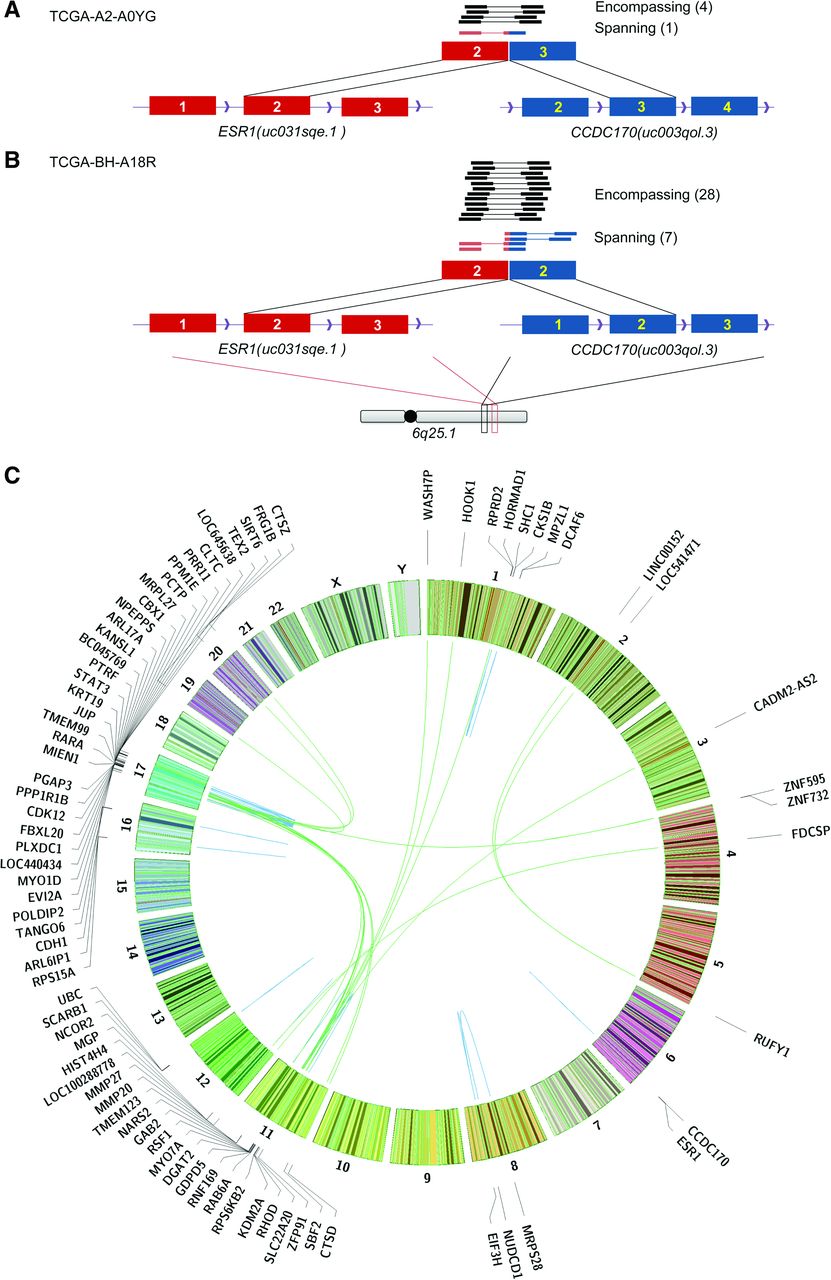
Hotspots of gene fusions in 62 TCGA breast cancer patients. (A) ESR1-CCDC170 fusion in TCGA-A2-A0YG. (B) ESR1-CCDC170 fusion in TCGA-BH-A18R. ESR1 (red) and CCDC170 (blue) are on the forward strand in region 6q25.1, and the 5′ gene ESR1 is downstream from the 3′ gene CCDC170. The two fusions share the same 5′ exon at ESR1 (Exon 2 of transcript uc031sqe.1), but 3′ exons of CCDC170 are different (Exons 2 and 3 of transcript uc003qol.3). (C) Circos plot of recurrent and functionally recurrent gene fusions detected by INTEGRATE. The green lines indicate inter-chromosomal gene fusions, and the blue lines indicate intra-chromosomal gene fusions. The names of the genes involved in each fusion are plotted on the outside of the circle. The gene fusions associate with several hotspots on Chromosomes 1, 11, and 17.


