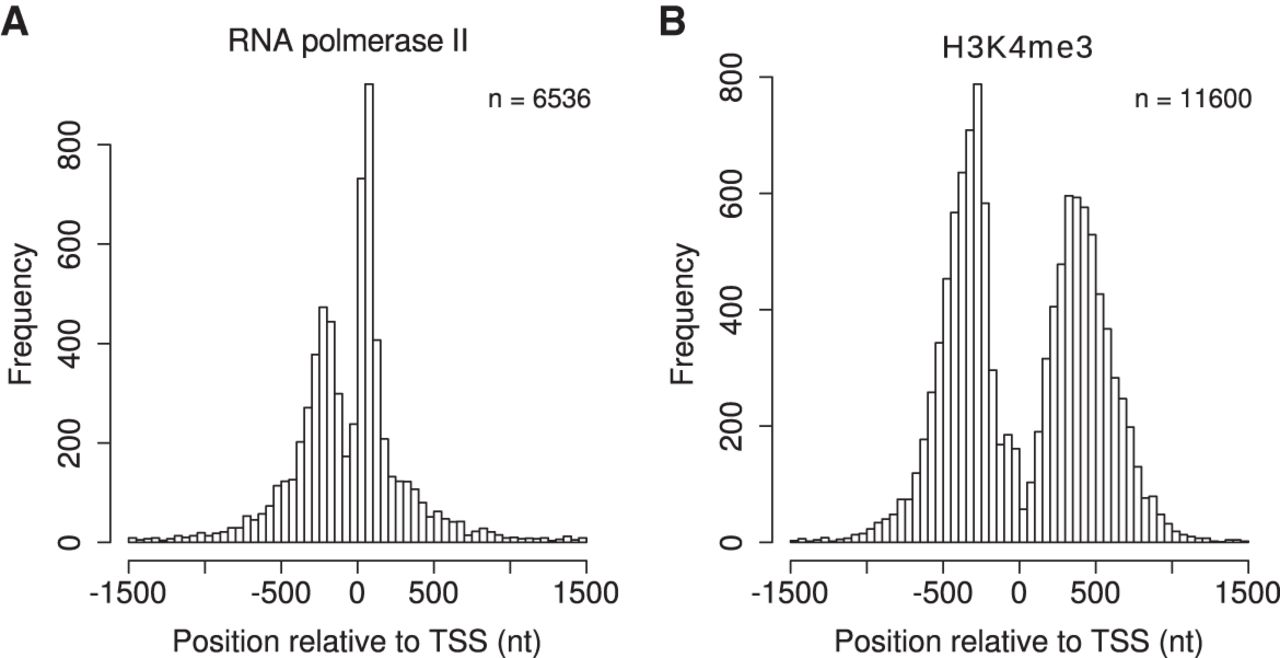
Saturation analysis of ChIP-seq data for reproducible identification of binding peaks

(Downloading may take up to 30 seconds. If the slide opens in your browser, select File -> Save As to save it.)

Click on image to view larger version.

Figure 6.
Figure 6.

Distribution of TSS flanking double summits (TFDSs). Each TFDS consists of two summits directly upstream of and downstream from the TSS. The TFDSs of Q for HCT-116 RNAPII (A) and HCT-116 H3K4me3 (B) were integrated over all non-overlapping promoters (TSS ± 1500 nt).

This Article

  1. Genome Res. 25: 1391-1400

Preprint Server