
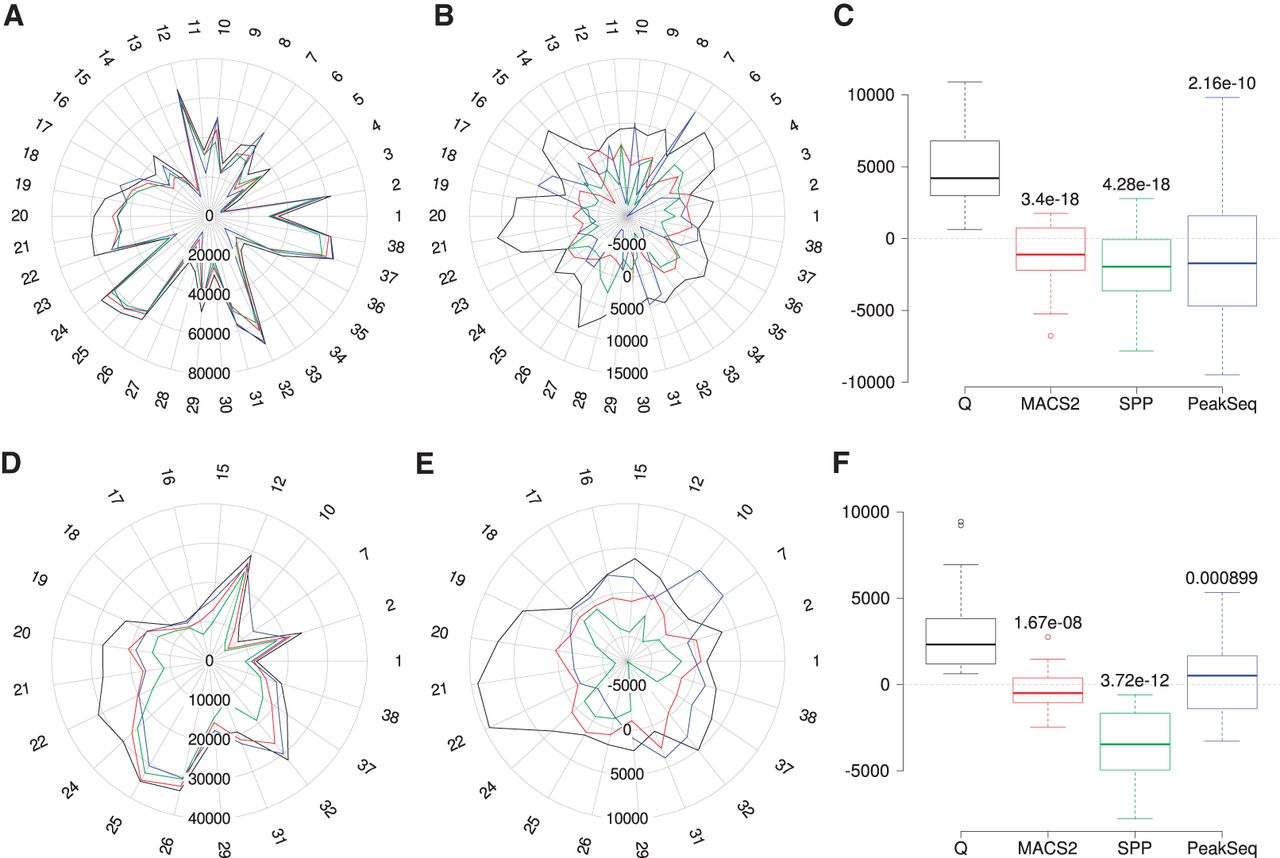
Reproducibility analysis for the 38 data sets. (A) Overlapping peak counts for the four peak callers (Q, black; MACS2, red; SPP, green; PeakSeq, blue). The numbers around the radar plots indicate the individual samples (Supplemental Table S1). (B) Mean normalized numbers for the data shown in A; the row mean (data from all four peak callers) was subtracted from each value. (C) Distribution of the mean normalized numbers for the overlapping peaks. P-values relative to Q were calculated using two-sample, two-sided Wilcoxon tests. (D–F) Panels are analogous to panels A through C except that the analysis is restricted to peaks with IDR ≤ 0.01. Data sets for which incompatibility with the IDR procedure was observed were excluded from the analysis (Supplemental Methods, Supplemental Figs. S5–S7; Supplemental Table S5).


