
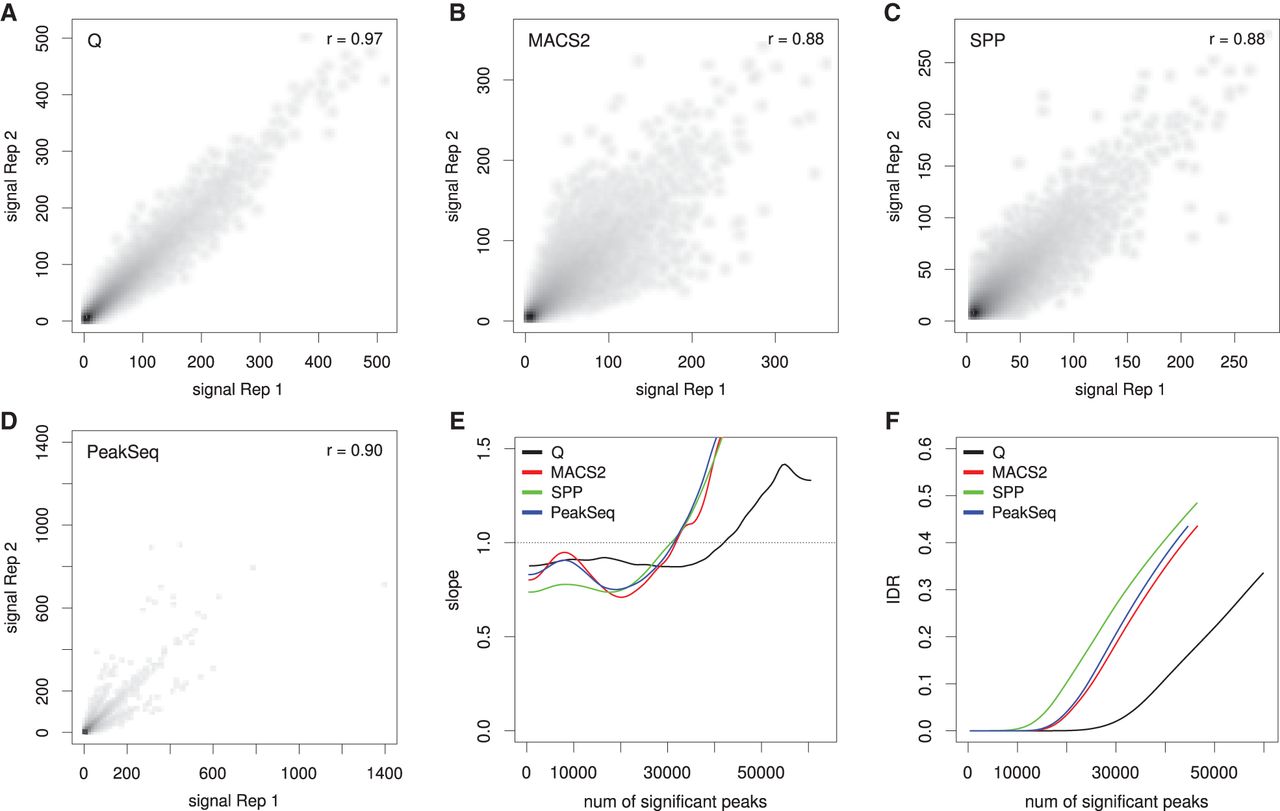
Reproducibility analysis for RNA polymerase II (RNAPII). The ENCODE data set HeLa-S3-POL2-REP1 is shown as an example. The alignment data were split randomly into two pseudoreplicates, and peaks were called using Q, MACS2, SPP, and PeakSeq. (A–D) The scatterplots show the negative decadic logarithm of P-values of Q (A), MACS2 (B), and PeakSeq (D), and signal values of SPP (C) for overlapping signals of the two pseudo replicates. Compared with the overlaps for MACS2 (46,976), SPP (45,759), and PeakSeq (45,022), Q shows a considerably larger overlap (60,450). In addition, Q shows the highest Pearson correlation coefficient (0.97) compared with three other methods. (E) Change of correspondence curve (Ψ′ plot) (Li et al. 2011). The peak set derived from Q remains consistent for about 15,000 peaks more than those of the other peak callers. (F) The plot shows the IDR at different numbers of selected peaks. For all peak counts, Q displays a considerably smaller proportion of irreproducible signals.


