
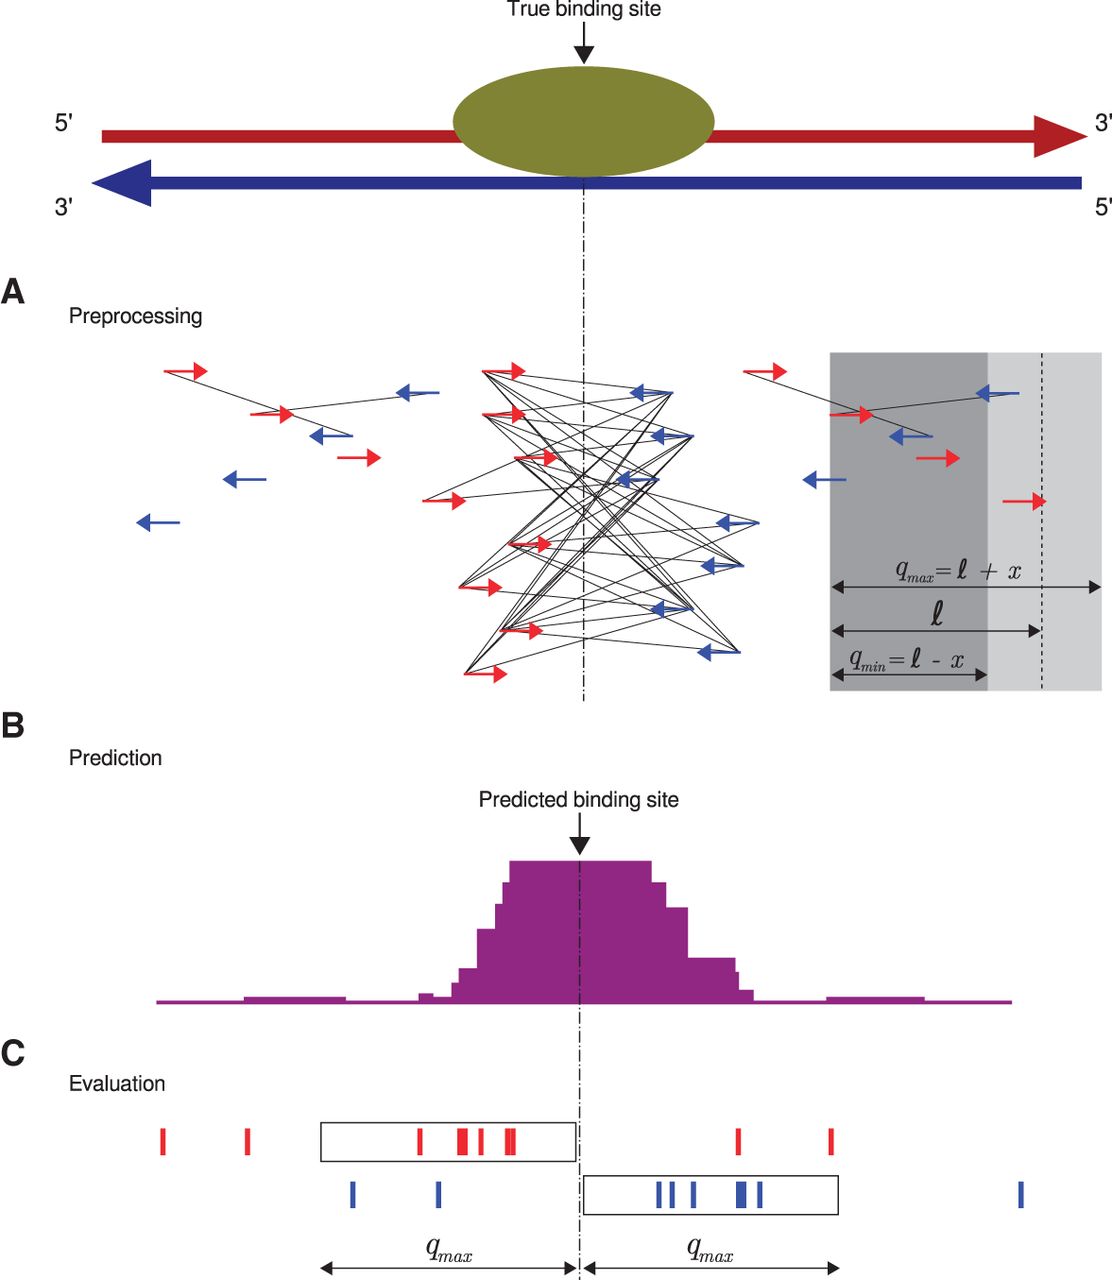
Q workflow. (A) A preprocessing step identifies “qfrags” as pairs of reads on opposite strands located within ℓ±x nucleotides from one another. In regions of true signal, this has the effect of approximately quadratically amplifying the signal, whence the name of the algorithm. The qfrags are shown as black lines connecting the 5′ ends of compatible reads. For instance, the red (forward strand) read at the left edge of the gray box can form a qfrag with any blue (reverse strand) read that is located in the light gray portion of the box (≥qmin and ≤qmax nucleotides). qfrags are symbolized by black lines between 5′ ends of red and blue reads. (B) The qfrag depth is calculated for each position along the genome. Candidate regions for hypothesis testing are identified as local qfrag height maxima (summits, or predicted binding sites). (C) Candidate regions are defined as the regions comprising the qmax nucleotides upstream of and downstream from the predicted binding site, and statistical testing is performed on each candidate peak based on the saturation analysis in a window defined by 2 · qmax.


