
Figure 1.
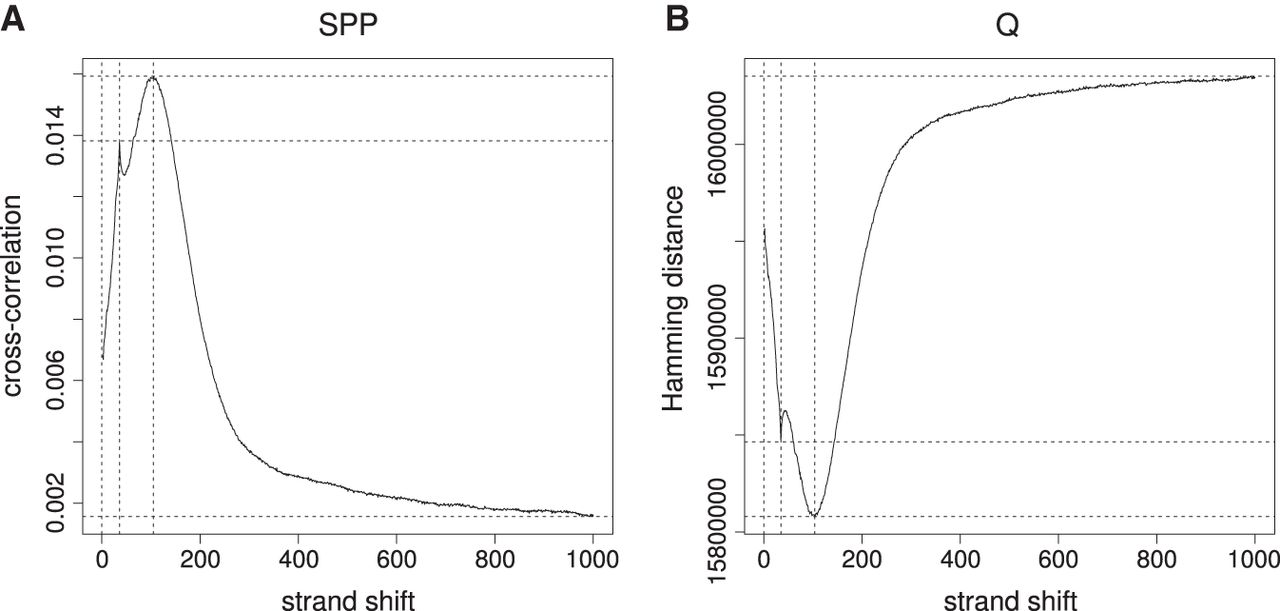
Fragment-length estimation. (A) Cross-correlation plot produced by SPP (Kharchenko et al. 2008) for GM12878-BATF-REP1. (B) Hamming distance plot produced by Q for the same data set.
(Downloading may take up to 30 seconds. If the slide opens in your browser, select File -> Save As to save it.)
Click on image to view larger version.
Fragment-length estimation. (A) Cross-correlation plot produced by SPP (Kharchenko et al. 2008) for GM12878-BATF-REP1. (B) Hamming distance plot produced by Q for the same data set.
 CiteULike
 Delicious
 Digg
Digg Facebook
 Google+
 Reddit
 Twitter
