
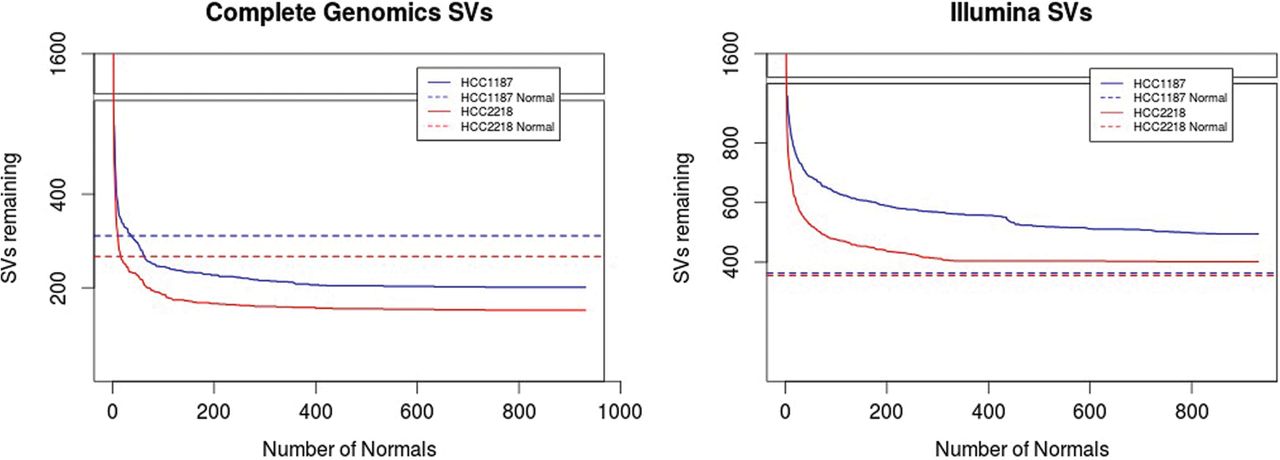
Figure 3.
Number of structural variants filtered out after each additional VN sample for Complete Genomics (left) and Illumina samples (right). Blue denotes the HCC1187 sample; red, CG HCC2218. Dashed lines indicate the level reached by correction with the associated normal.


