
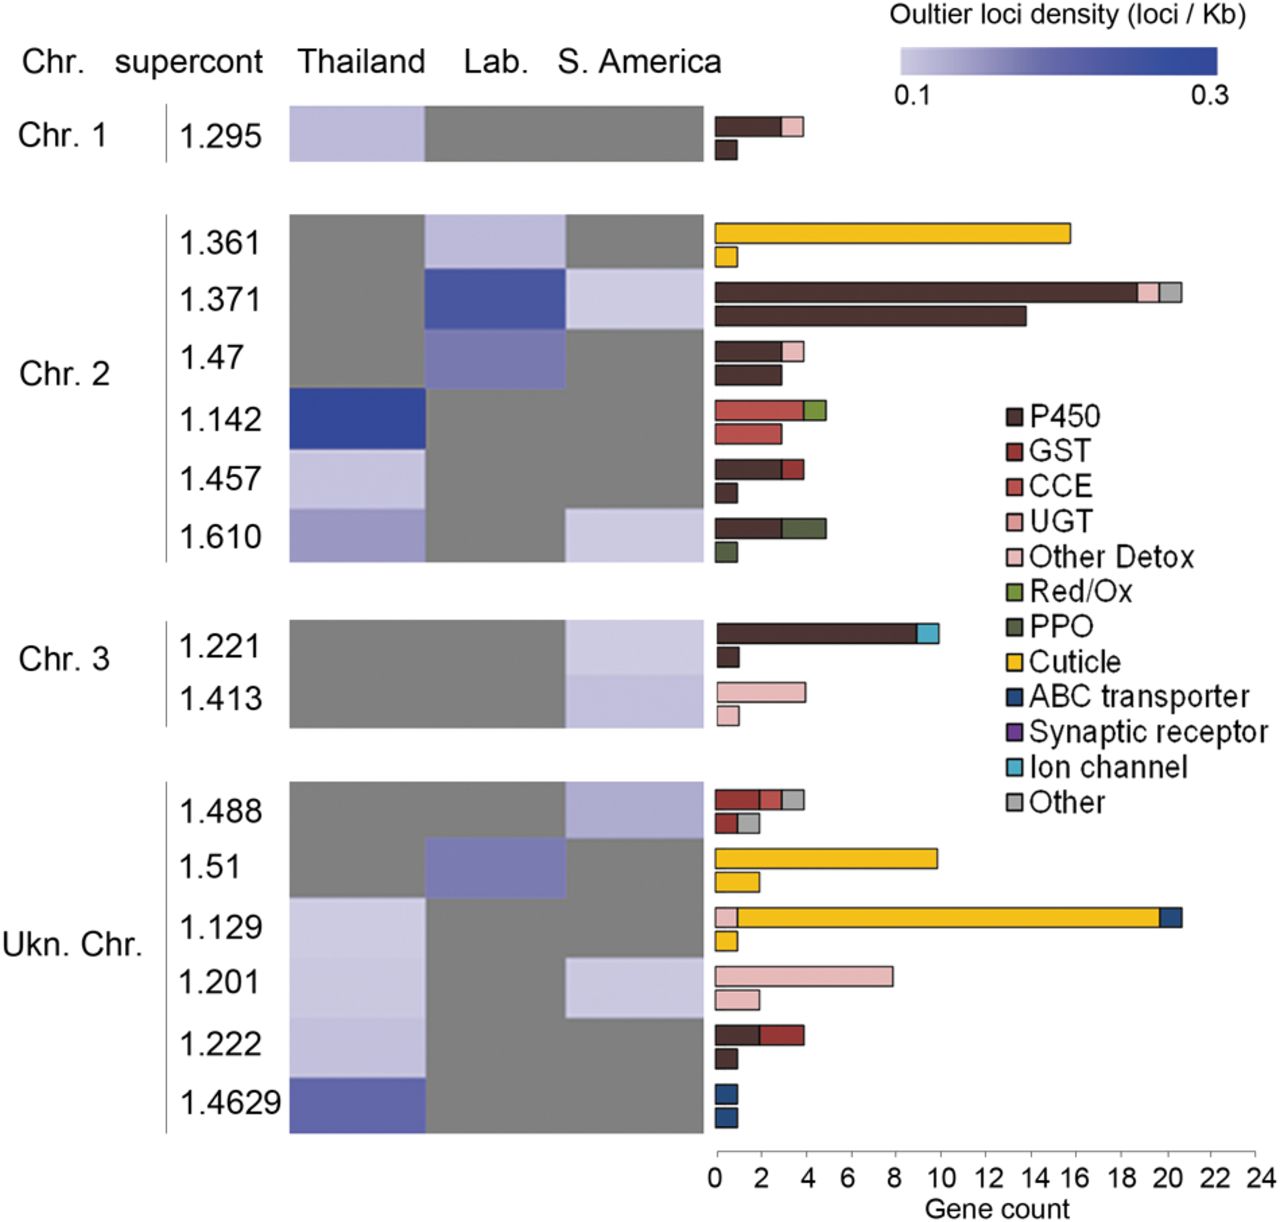
Supercontigs showing selection footprint. For each region, loci displaying a significant BayeScan3 Fsc Q-value <0.05 and both f(R+)-f(S) and f(R+)-f(R−) allele frequency variation occurring in the same direction were considered as outliers. For each supercontig, outlier loci densities were obtained by dividing the number of outlier loci by the total length of all captured genes (outlier loci per kb of captured region). Outlier loci densities are shown as a blue color scale. Gray stands for an absence of outlier loci. For each supercontig, horizontal bars show the number of captured genes from each gene family (upper bar) compared to those affected by outlier loci (lower bar). Supercontigs are clustered according to their putative chromosomal location as described in Timoshevskiy et al. (2014) and Juneja et al. (2014).


