
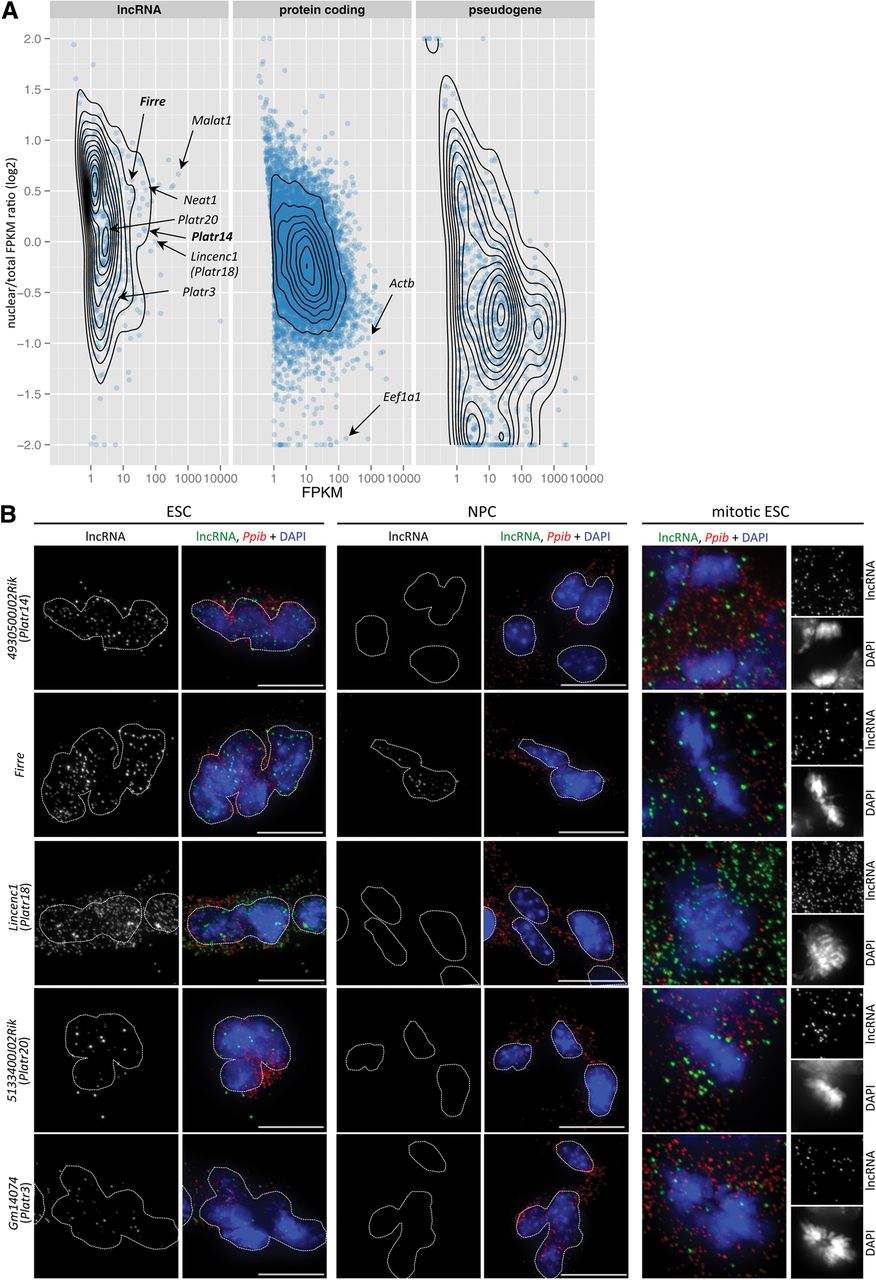
Figure 2.
Identification of nuclear-enriched lncRNAs. (A) Nuclear to total log2 FPKM ratio by annotated gene biotype (Ensembl v.76) in AB2.2 ESCs plotted against FPKM values obtained from total cell RNA-seq. Only genes with expression >1 FPKM in either nuclear or total fraction are plotted. (B) Single-molecule RNA FISH in AB2.2 ESCs and NPCs using probe pairs specific for Platr14, Firre, and other indicated lncRNAs (green). Housekeeping Ppib mRNA (red) is used as a control. Images represent maximum intensity projections. Dotted lines demarcate the nuclear outline of individual cells or ESC colonies. (Scale bar) 10 µm. Mitotic images are enlarged twofold.


