
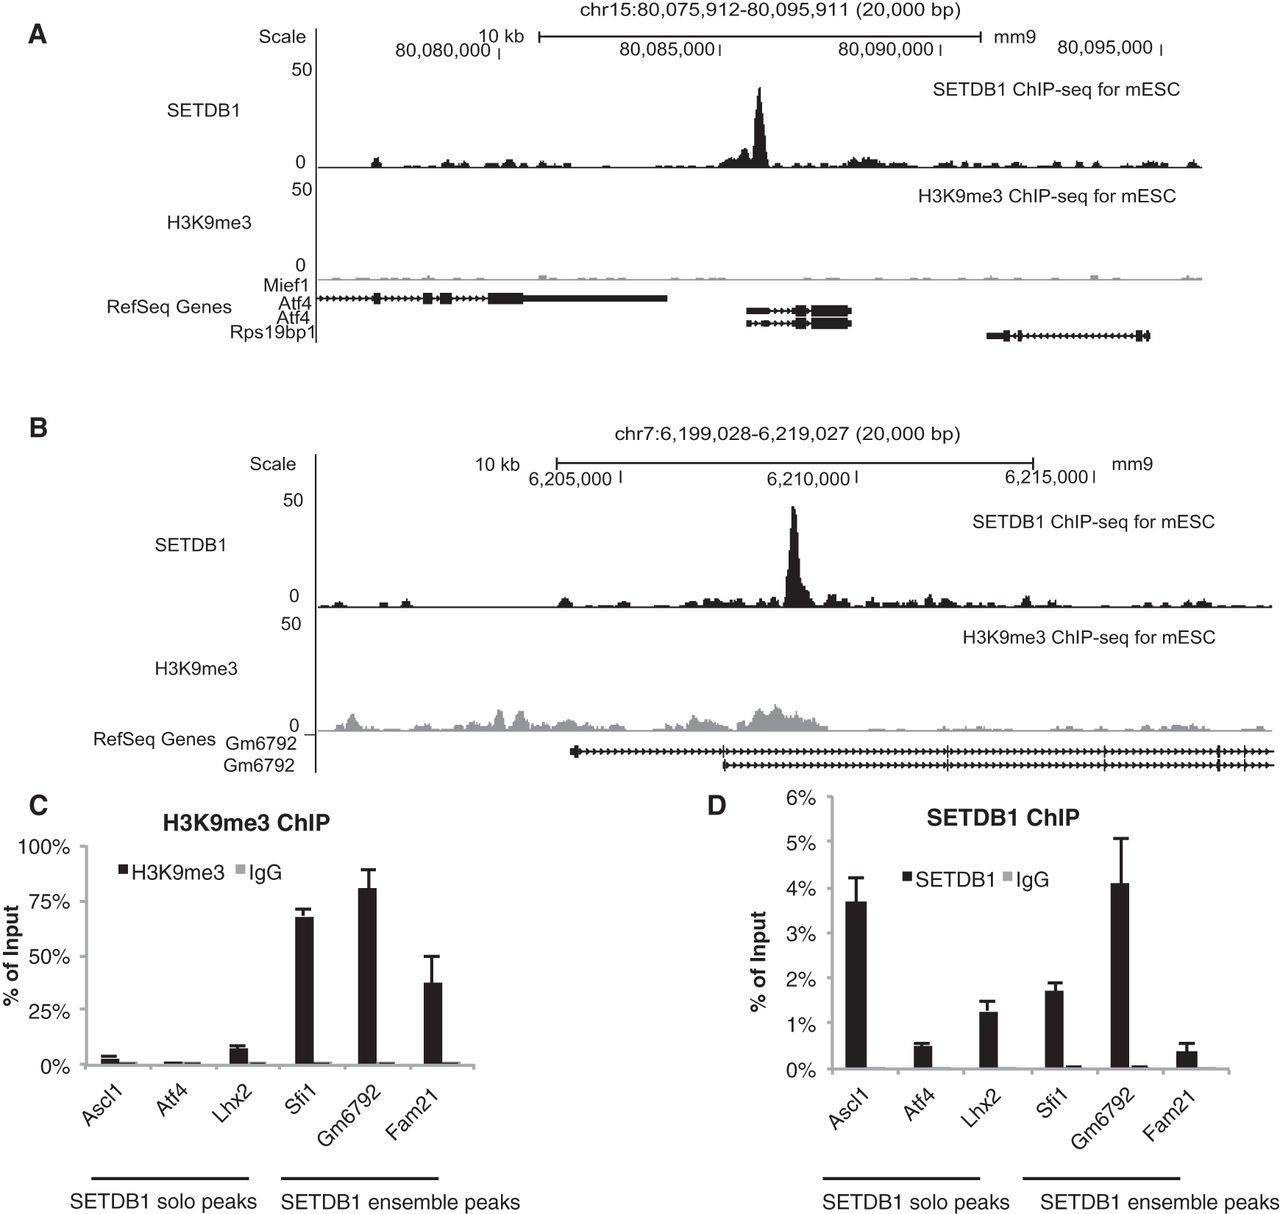
Classification of SETDB1 targets to solo and ensemble peaks. (A) Examples for SETDB1 solo (around Atf4 promoter) peaks. (Top) Track is the ChIP-seq profile of SETDB1 in wild-type mouse ES cells (Yuan et al. 2009). (Bottom) Track is the H3K9me3 ChIP-seq (biological replicate 1) signal in Setdb1 iKO cells (without Tam treatment). (B) Examples for SETDB1 ensemble (around Gm6792 promoter) peaks. (Top) Track is the ChIP-seq profile of SETDB1 in wild-type mouse ES cells (Yuan et al. 2009). (Bottom) Track is the H3K9me3 ChIP-seq (biological replicate 1) signal in Setdb1 iKO cells (without Tam treatment). (C) ChIP-qPCR of H3K9me3 in selected SETDB1 peak loci. Setdb1 iKO mouse ES cells underwent ChIP with H3K9me3 antibody. Anti-rabbit normal IgG was used as a negative control. The enrichment level was normalized to input. The selected SETDB1 peak loci were marked by their nearby gene symbols (Atf4, Lhx2, Ascl1 for SETDB1 solo peaks; Fam21, Gm6792, Sfi1 for SETDB1 ensemble peaks). (D) ChIP-qPCR of SETDB1 in selected SETDB1 peak loci. Setdb1 iKO mouse ES cells underwent ChIP with SETDB1 antibody. Anti-rabbit normal IgG was used as a negative control. The enrichment level was normalized to input. The selected SETDB1 peak loci were marked by their nearby gene symbols (Atf4, Lhx2, Ascl1 for SETDB1 solo peaks; Fam21, Gm6792, Sfi1 for SETDB1 ensemble peaks).


