
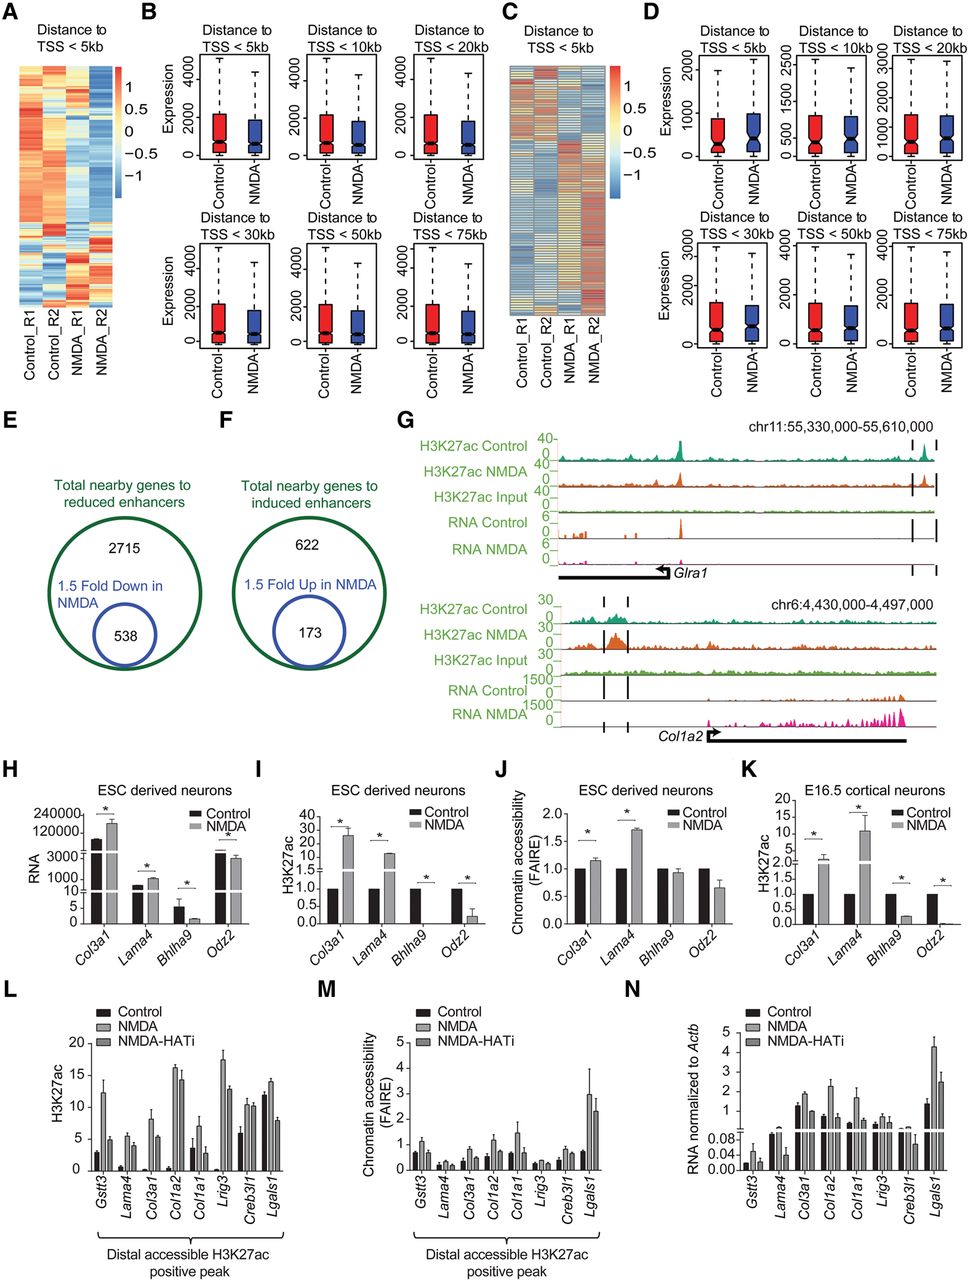
Neuronal activity-dependent transcriptome changes are driven via distal regulatory elements. (A) Heat map showing the expression of genes (within a 5-kb window) near down-regulated H3K27ac-positive distal regulatory regions in the control and NMDA treatments. (B) Box plots showing differences in the expression of genes near down-regulated H3K27ac-positive distal regulatory regions after the genes were binned based on their distance (5, 10, 20, 30, 50, and 75 kb) from these sites. P-values for the differences between control and NMDA conditions for distances 5 kb (n = 911), 10 kb (n = 1076), 20 kb (n = 1367), 30 kb (n = 1621), 50 kb (n = 1970), and 75 kb (n = 2252) are 1.5 × 10−54, 5.7 × 10−56, 3.4 × 10−51, 1.4 × 10−55, 1.5 × 10−54, and 4.4 × 10−56, respectively. P-values are calculated using the Wilcoxon test. (C) Same as in A but for up-regulated H3K27ac-positive distal regulatory regions. (D) Same as in B but for up-regulated H3K27ac-positive distal regulatory regions. P-values for the differences between control and NMDA conditions for distances 5 kb (n = 97), 10 kb (n = 171), 20 kb (310), 30 kb (406), 50 kb (528), and 75 kb (n = 608) are 0.0005, 0.05, 0.04, 0.13, 0.56, and 0.91, respectively. (E,F) Venn diagram showing overlap of genes near down-regulated distal regulatory regions (green circle) with genes at least 1.5-fold down-regulated upon NMDA treatment (blue circle) (E) and up-regulated distal regulatory regions (green circle) with genes at least 1.5-fold up-regulated (blue circle) (F). (G) Browser plots showing concomitant loss (Glra1) or gain (Col1a2) of distal H3K27ac and expression. (H) Normalized tag counts from RNA-seq data of selected genes that show changes in H3K27ac at their distal regions upon NMDA treatment. (I) ChIP-qPCR validation of NMDA-dependent H3K27ac changes for the distal regions for genes shown in (H). (J) FAIRE-qPCRs to asses changes in chromatin accessibility at the same regions shown in (I) upon NMDA treatment. (K) ChIP-qPCR validation of NMDA-dependent H3K27ac changes for the distal regions of genes shown in H in mouse cortical neurons treated with NMDA. (L–N) Bar plots showing analysis of H3K27ac (by ChIP-qPCRs) (L), chromatin accessibility (by FAIRE-qPCRs) (M), of selected distal regions and expression of nearest genes (by RT-qPCRs) (N), following NMDA stimulation in the presence and absence HAT inhibitor (C646). All error bars represent the SEM of independent biological replicates. (*) P < 0.05, Student's t-test.


