
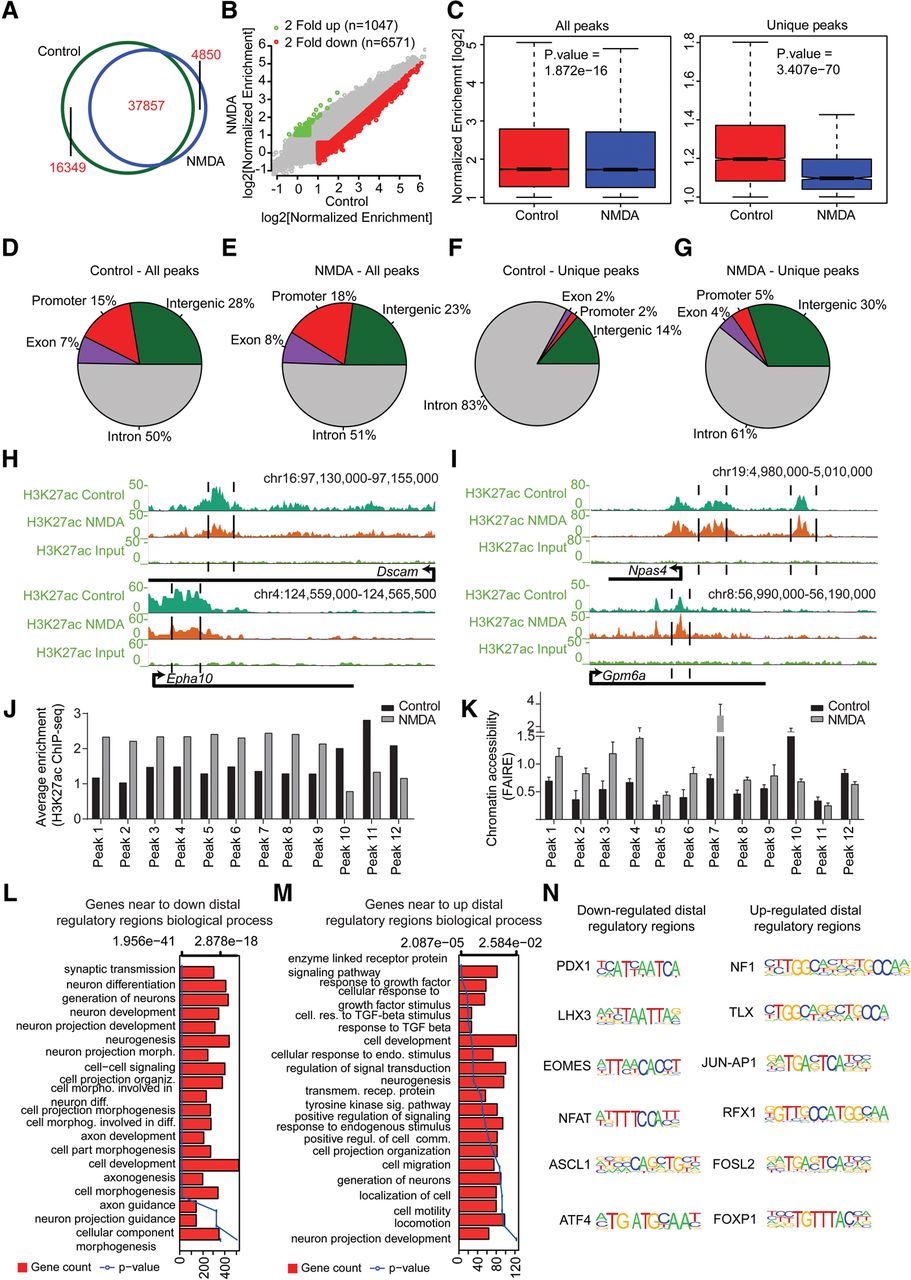
Prolonged NMDA activity results in a massive modulation of the distal regulatory landscape. (A) Venn diagram showing overlap of H3K27ac peaks identified in control- and NDMA-treated day 10 neurons. (B) Scatter plot showing the gain and loss of H3K27ac sites. Peaks marked in green are either only present in NMDA or at least twofold up-regulated compared with control; peaks marked in red represent the opposite. The x- and y-axes represent the normalized enrichment of H3K27ac in control and NDMA treated neurons. (C) Box plots showing the loss of H3K27ac upon NMDA treatment compared with control at all and unique peaks. P-values are calculated using the Wilcoxon test. (D–G) Pie charts showing the distribution of control or NMDA peaks in different genomic regions for all (D,E) and unique (F,G) peaks. (H) Browser plots showing loss of H3K27ac at potential distal regulatory regions of neuronal genes (Dscam and Epha10). (I) Same as in H but showing gain of H3K27ac at potential distal regulatory regions of activity-related genes. (J) Bar plot showing normalized H3K27ac enrichment of selected distal peaks in control and NMDA-treated neurons as derived from the ChIP-seq data set. (K) FAIRE assay was performed in cells treated with NMDA, and qRT-PCRs were performed for the same distal regulatory regions as in J. Average enrichments from independent assays are plotted on the y-axis as a ratio of precipitated DNA (bound) to total input DNA and then further normalized to an intergenic region. Error bars represent the SEM of independent biological replicates. (L,M) Bar plots showing the enrichment of biological processes for genes near down-regulated (L) and up-regulated (M) distal regulatory regions. The bars reflect the number of genes in each category; the lines represent the multiple testing-corrected P-value, displayed on alternate x-axis, of the corresponding GO term. (N) Representative motifs identified in down- and up-regulated distal regulatory regions.


