
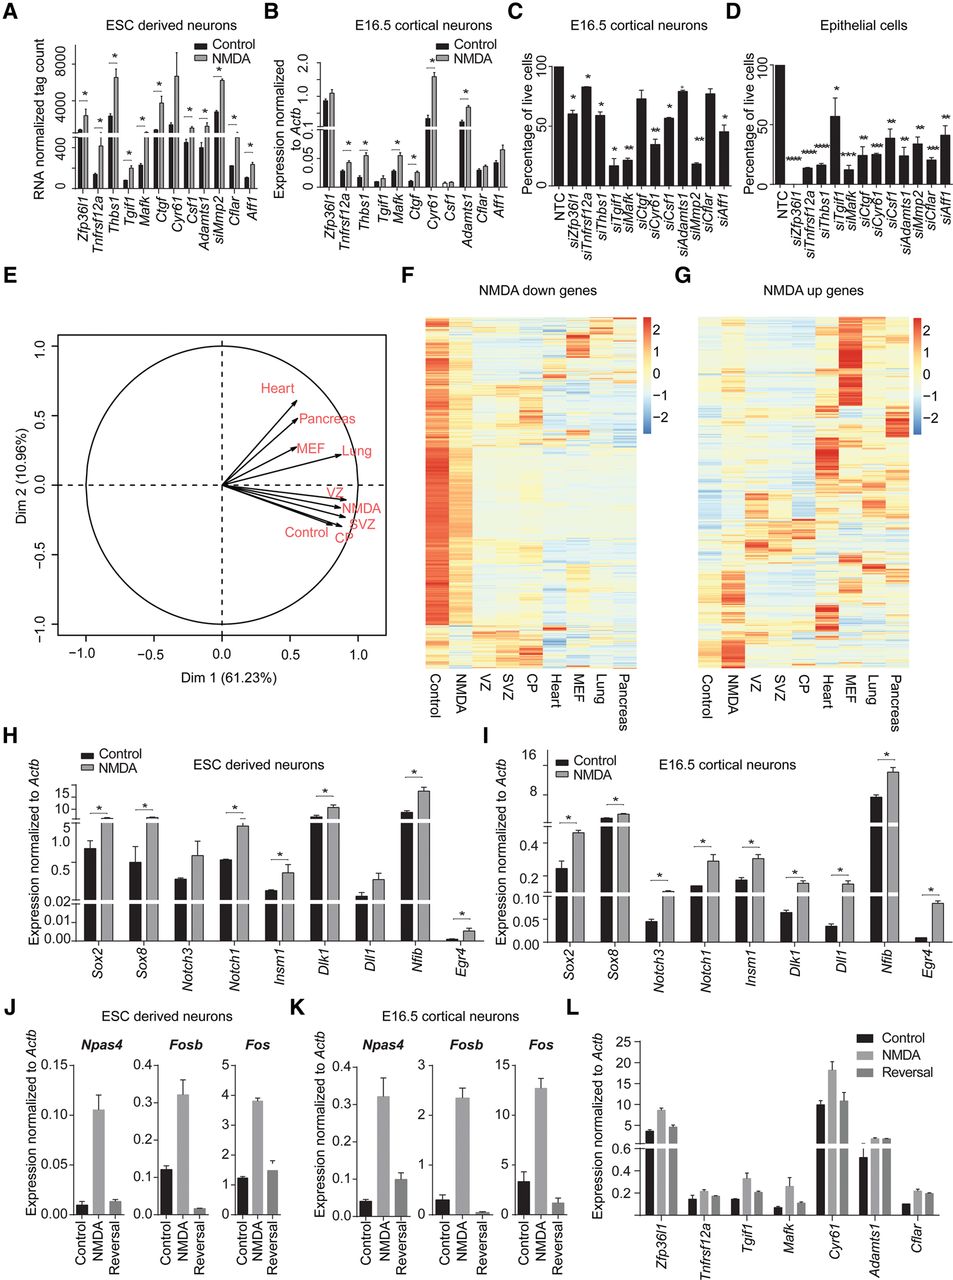
NMDA receptor stimulation causes induction of non-neuronal and prosurvival genes. (A) Expression values from RNA-seq (normalized tag counts) of selected potential prosurvival candidate genes that are induced upon NMDA. Error bars represent the SEM of independent biological replicates. (B) mRNA levels for selected prosurvival genes (as in A) in NMDA-induced cortical neurons were measured by qRT-PCR relative to Actb and plotted on the y-axis. Error bars represent the SEM of independent biological replicates. (C) Bar plot showing the percentage of live cells upon siRNA-mediated knock down of prosurvival candidates compared with nontargeting control (NTC) in cortical neurons. Error bars represent the SEM of independent biological replicates. (D) Similar analysis as in C but knock down performed in epithelial cells. Error bars represent the SEM of independent biological replicates. (E) Principal component analysis (PCA) plot of control- and NMDA-treated day 10 neurons with ventricular zone (VZ), subventricular zone (SVZ), cortical plate (CP), lung, pancreas, heart, and MEF transcriptomes. (F) Heat map showing the expression of genes down-regulated by NMDA treatment in different tissues from three germ layers (ectoderm: VZ, SVZ, and CP; endoderm: pancreas and lung; mesoderm: heart and MEF). (G) Same as in F but for up-regulated genes. (H,I) Bar plots showing mRNA levels for known neuronal progenitor genes in NMDA-induced ESC-derived neurons (H) and cortical neurons (I) measured by qRT-PCR relative to Actb and plotted on the y-axis. Error bars represent the SEM of independent biological replicates. (J,K) Bar plots showing mRNA levels of key synaptic activity genes upon NMDA treatment and following NMDA withdrawal both in ESC-derived neurons (J) and cortical neurons (K) measured by qRT-PCR relative to Actb and plotted on the y-axis. Error bars represent the SEM of independent biological replicates. (L) Similar analysis as in J was performed in ESC-derived neurons but for prosurvival genes. (*) P < 0.05; (**) P < 0.01; (***) P < 0.001; (****) P < 0.0001, Student's t-test.


