
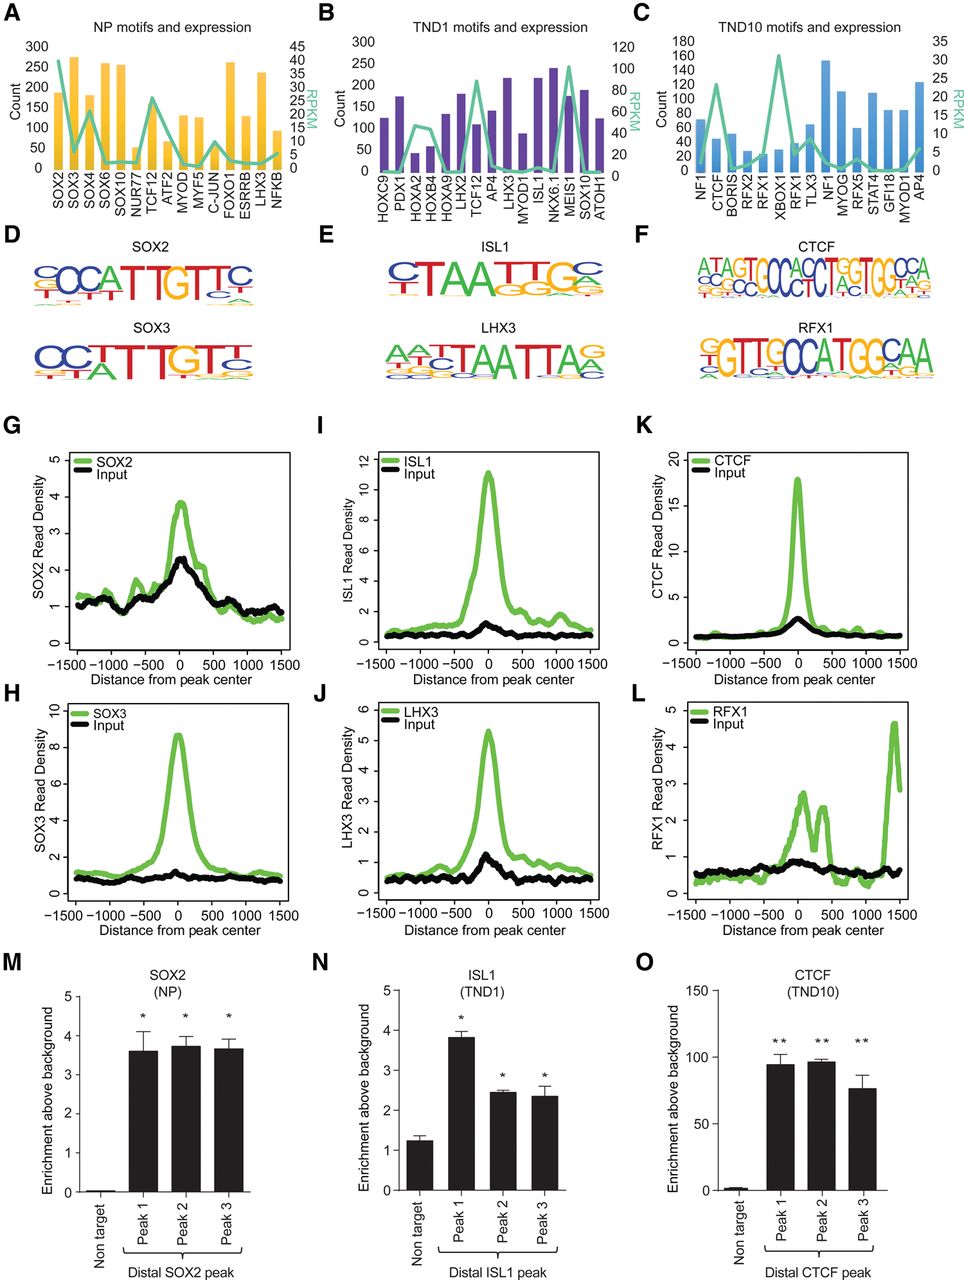
Distinct transcription factors are targeted to distal regulatory elements in a stage-specific manner during neurogenesis. (A–C) Bar and overlapping line plot showing identified motifs and their counts in NP, TND1, and TND10 at uniquely gained H3K27ac nonpromoter sites (bars, main y-axis) and their expression (line, alternate y-axis, light green). (D–F) Motif sequence of the selected transcription factors from the three stages. (G–L) Plots showing enrichment of the corresponding transcription factors around the center of the uniquely gained open H3K27ac peaks in NP (SOX2 and SOX3) (G,H), TND1 (LHX3 and ISL1) (I,J), and TND10 (CTCF and RFX1) (K,L). The x-axis shows the distance from the peak center; the y-axis represents normalized enrichment of the corresponding transcription factor. (M–O) ChIP-qPCR validation of selected distal regions for their occupancy using specific antibody, SOX2 in NP (M), ISL1 in TND1 (N), and CTCF in TND10 (O). Average enrichments from independent assays are plotted on the y-axis as a ratio of precipitated DNA (bound) to total input DNA and then further normalized to an intergenic region. Error bars represent the SEM of independent biological replicates. (*) P < 0.05; (**) P < 0.01, Student's t-test.


