
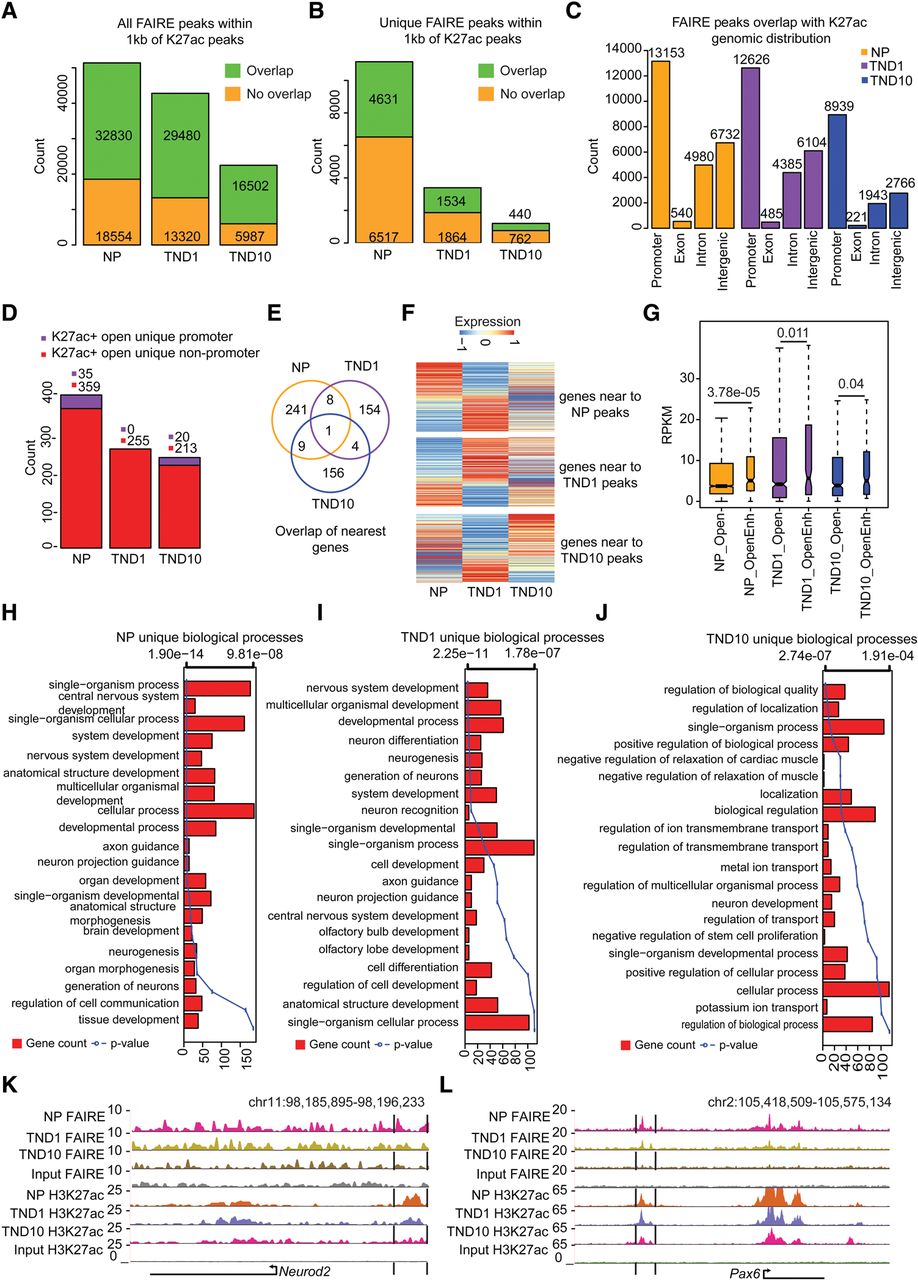
Distal regulatory elements define the cell-type–specific transcriptome during neuronal development. (A) Stacked bar plot showing fraction of total FAIRE peaks overlapping with H3K27ac sites in NP, TND1, and TND10. Peaks were considered to be overlapping if they were within a distance of 1 kb. (B) Same as in A but for unique peaks. (C) Bar plot showing the distribution of FAIRE and H3K27ac overlapping peaks in different genomic regions in NP, TND1, and TND10 stages. (D) Stacked bar plot showing promoter and nonpromoter peaks that are open and uniquely acquire H3K27ac in NP, TND1, and TND10. (E) Venn diagram representing the overlap of genes near the sites identified in D. (F) Heat map showing expression of genes nearest to the peaks that uniquely gain H2K27ac in NP, TND1, or TND10. (G) Box plot showing differences in expression for genes that are near open H3K27ac sites (OpenEnh) and only open sites (Open). P-values are calculated using the Wilcoxon test. (H–J) Bar plots showing enrichment of biological processes for genes near NP, TND1, and TND10 open and unique H3K27ac-positive sites. The bars reflect the number of genes in each category, and the lines represent the multiple testing-corrected P-values, displayed as an alternate x-axis, of the corresponding GO terms. (K,L) Browser tracks for Neurod2 and Pax6 showing potential distal regulatory regions.


