
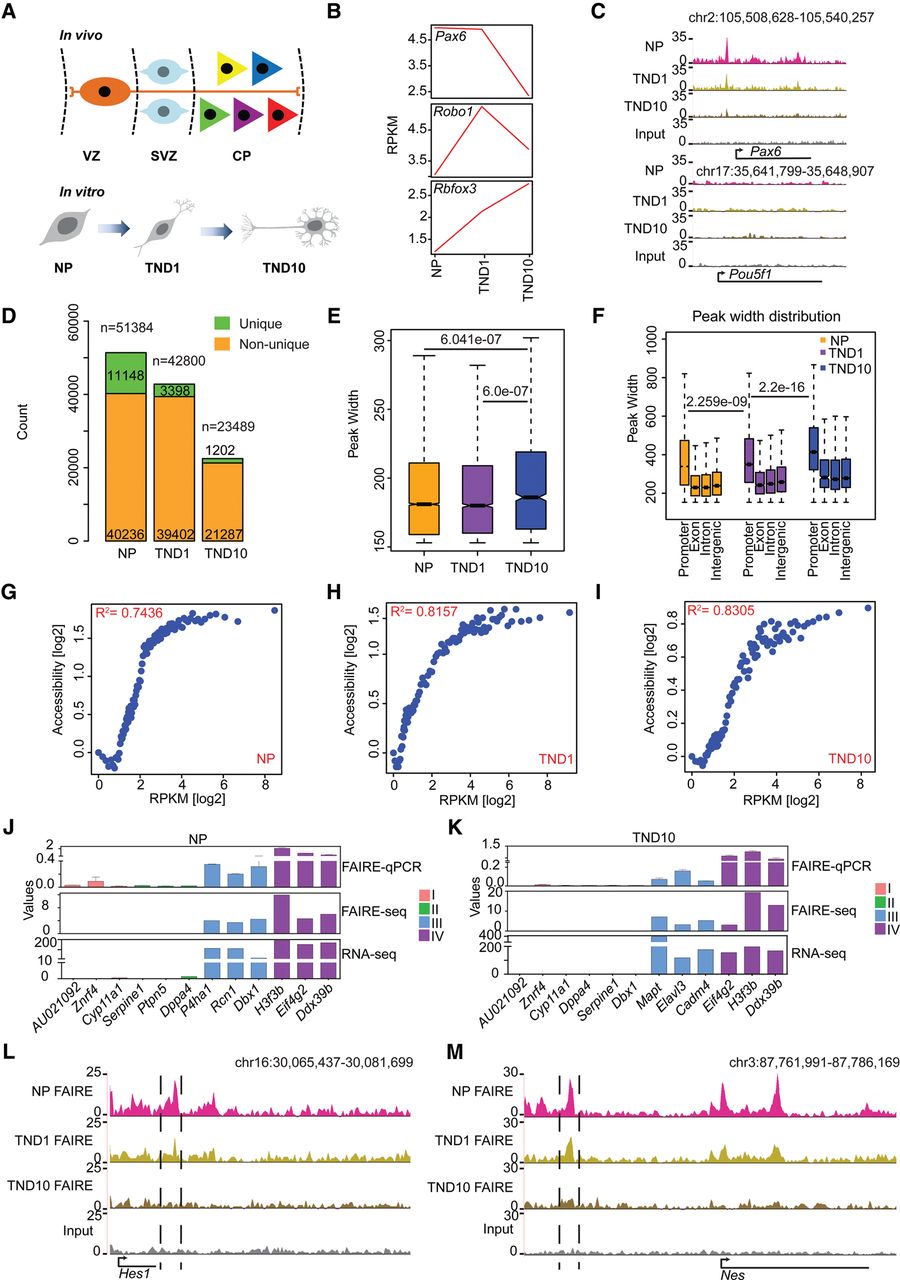
FAIRE-seq sensitively identifies proximal and distal accessible regions during neuronal differentiation. (A) Schematic representation of the in vitro differentiation system compared to respective in vivo stages. (B) Line plot showing the expression of established marker genes for different neuronal stages. (C) UCSC Genome Browser tracks indicating the presence of an open region at Pax6 promoter (gene active in NP) and the absence of any active region in the Pou5f1 gene locus (active in ES cells only). (D) Stacked bar plot of the total and unique FAIRE peak count. (E) Box plot showing distribution of peak widths of unique NP, TND1, and TND10 peaks. P-values are calculated using the Wilcoxon test. (F) Peak width distribution in different genomic regions. P-values are calculated using the Wilcoxon test. (G–I) Scatter plot comparing gene expression and promoter accessibility. Genes were binned into percentiles, and the mean expression and mean promoter accessibility of each bin were plotted. The x-axis shows gene expression in reads per kilobase of transcript per million mapped reads (RPKM); the y-axis represents normalized FAIRE enrichment at promoters. (J,K) FAIRE-qPCR validation of promoter accessibility and gene expression. Genes are categorized into four classes: (I) not expressed in any of the three stages; (II) not expressed in the analyzed stage but expressed in at least one other stage; (III) expression specific to the analyzed stage; and (IV) expressed in all the stages. Values on the y-axis represent FAIRE/input normalized to Hspa8 (FAIRE qPCR), normalized enrichment score (FAIRE-seq), and RPKM for normalized expression (RNA-seq). (L) UCSC Genome Browser tracks showing the presence of a distal regulatory element near Hes1 (a NP specific gene). (M) Same as in L for the nestin gene (Nes).


