
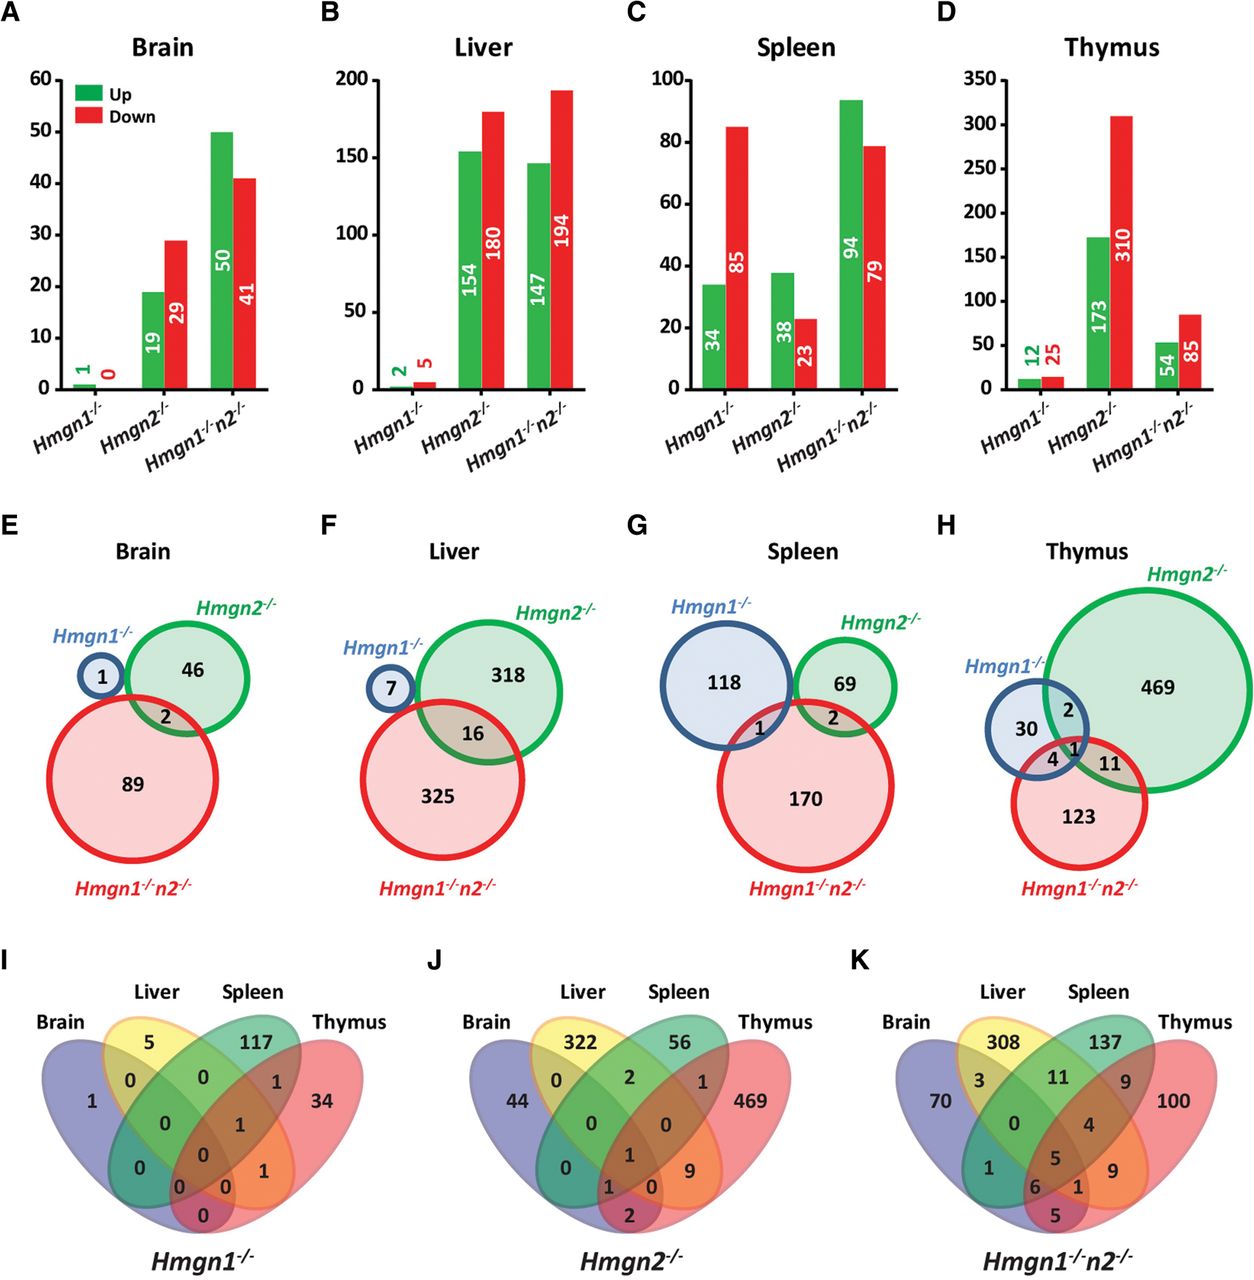
Figure 6.
Effect of HMGN loss on global gene expression in mouse tissues. (A–D) Number of genes up- and down-regulated in the four tissues of the three Hmgn−/− mice lines compared to WT littermates. (E–H) Venn diagrams showing the overlap in the number of genes with altered expression in the tissues of each of the three genotypes examined. (I–K) Venn diagrams showing the overlap between the genes altered in the different tissues of each genotype.


