
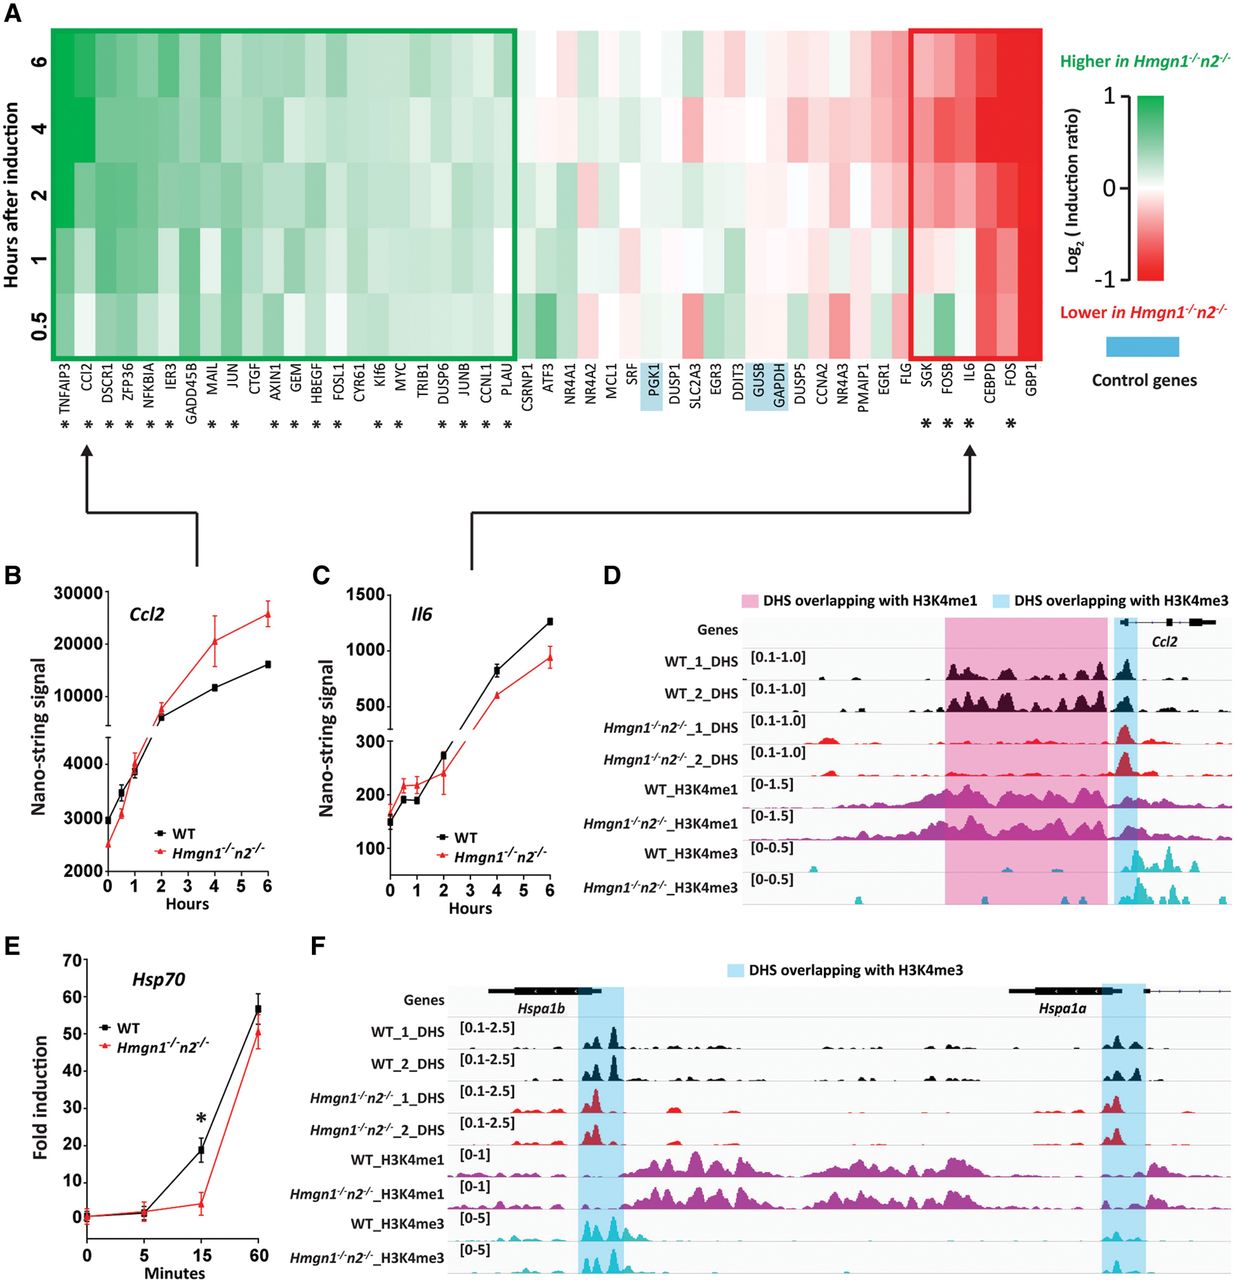
Altered immediate early (IE) gene expression in Hmgn1−/−n2−/− MEFs. (A) Heat map showing the induction fold ratios of IE genes in WT and Hmgn1−/−n2−/− MEFs. Boxes separate the genes that were up-regulated and down-regulated from the unaffected genes. (*) P < 0.05; two biological replicates were analyzed. (B,C) Kinetics of anisomycin-induced expression of Ccl2 and Il6. (D) Genome browser view of changes in DHSs at H3K4me1 and H3K4me3 sites 5′ to the Ccl2 gene. Numbers in parentheses indicate the scales of the y-axes. (E) Altered induction of heat shock genes in Hmgn1−/−n2−/− MEFs. (F) Genome browser view of changes in DHSs at H3K4me1 and H3K4me3 sites near the Hspa1a and Hspa1b genes. Numbers in parentheses indicate the scales of the y-axes.


