
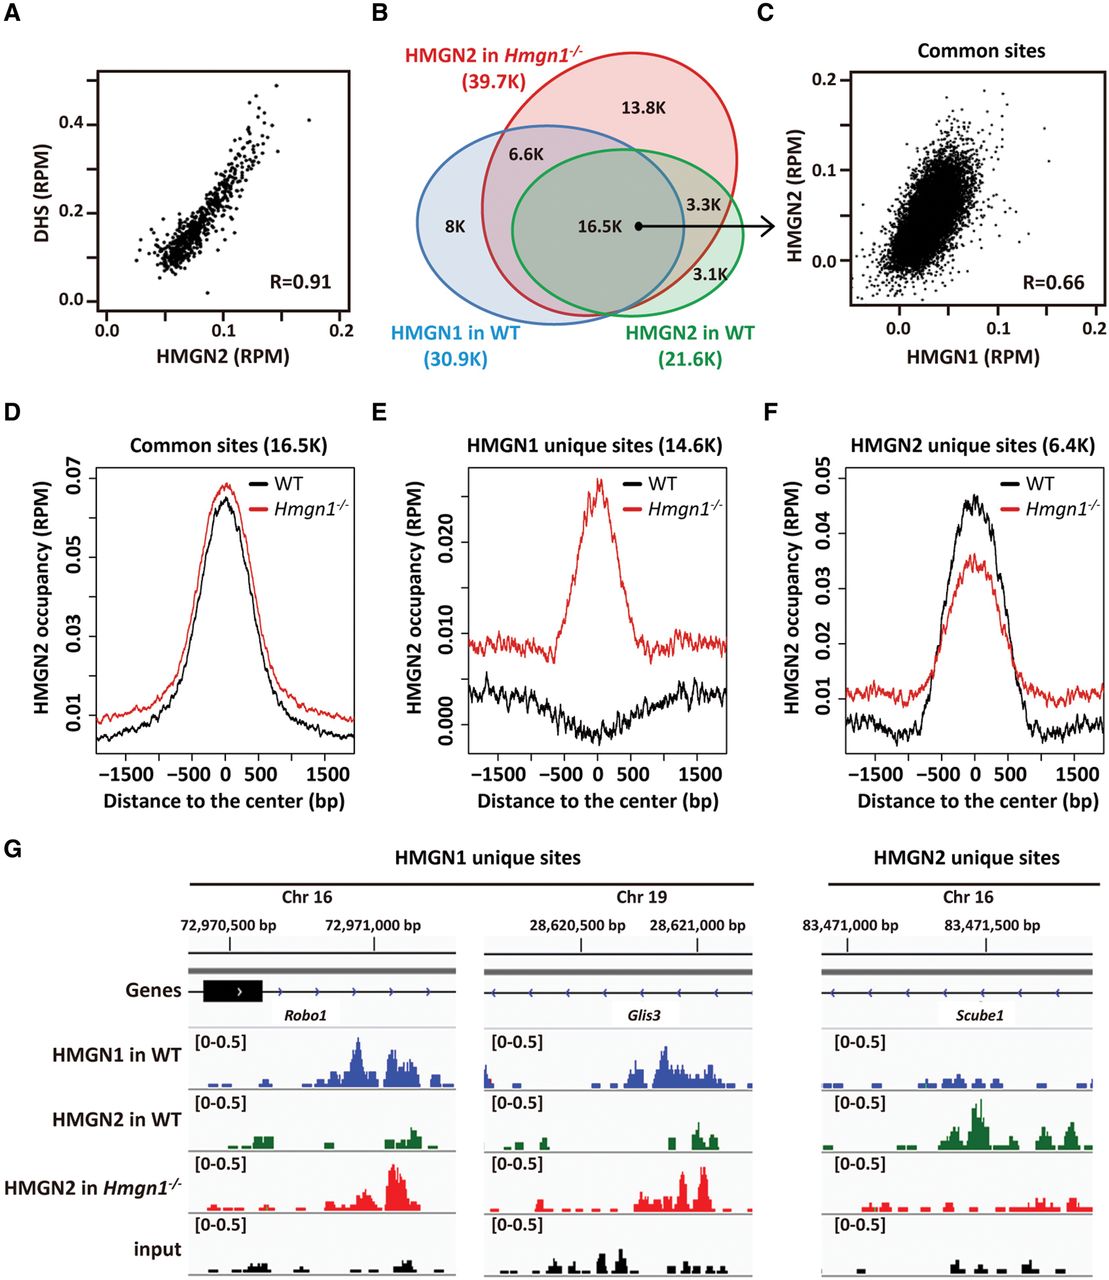
Compensatory binding of HMGN variants to NP chromatin. (A) Scatter plot showing correlation between HMGN2 binding and DNase I hypersensitivity at all DHSs. Normalized coverage depths of both HMGN2 and hypersensitivity were calculated at all DHSs, sorted by DHS coverage depths, grouped into 50 data point bins, and averaged. (R) Pearson correlation coefficient. (B) Venn diagram showing the overlap in the chromatin occupancy between HMGN1 and HMGN2 in wild-type (WT) NPs and the HMGN2 occupancy in Hmgn1−/− NPs. (C) Scatter plot showing colocalization of HMGN1 and HMGN2 in WT NPs. ChIP-seq signals are normalized over each site in reads per million (RPM). (D–F) Redistribution of HMGN2 occupancy upon loss of HMGN1. Shown is the occupancy of HMGN2 in WT and Hmgn1−/− NPs at sites occupied by either HMGN1, HMGN2, or both of the variants in WT cells. Note the shift in HMGN2 occupancy from HMGN2 unique sites to HMGN1 unique sites. (G) Genome browser view of HMGN occupancy in WT and Hmgn1−/− NPs. All the y-axes span from 0 to 0.5 as indicated.


