
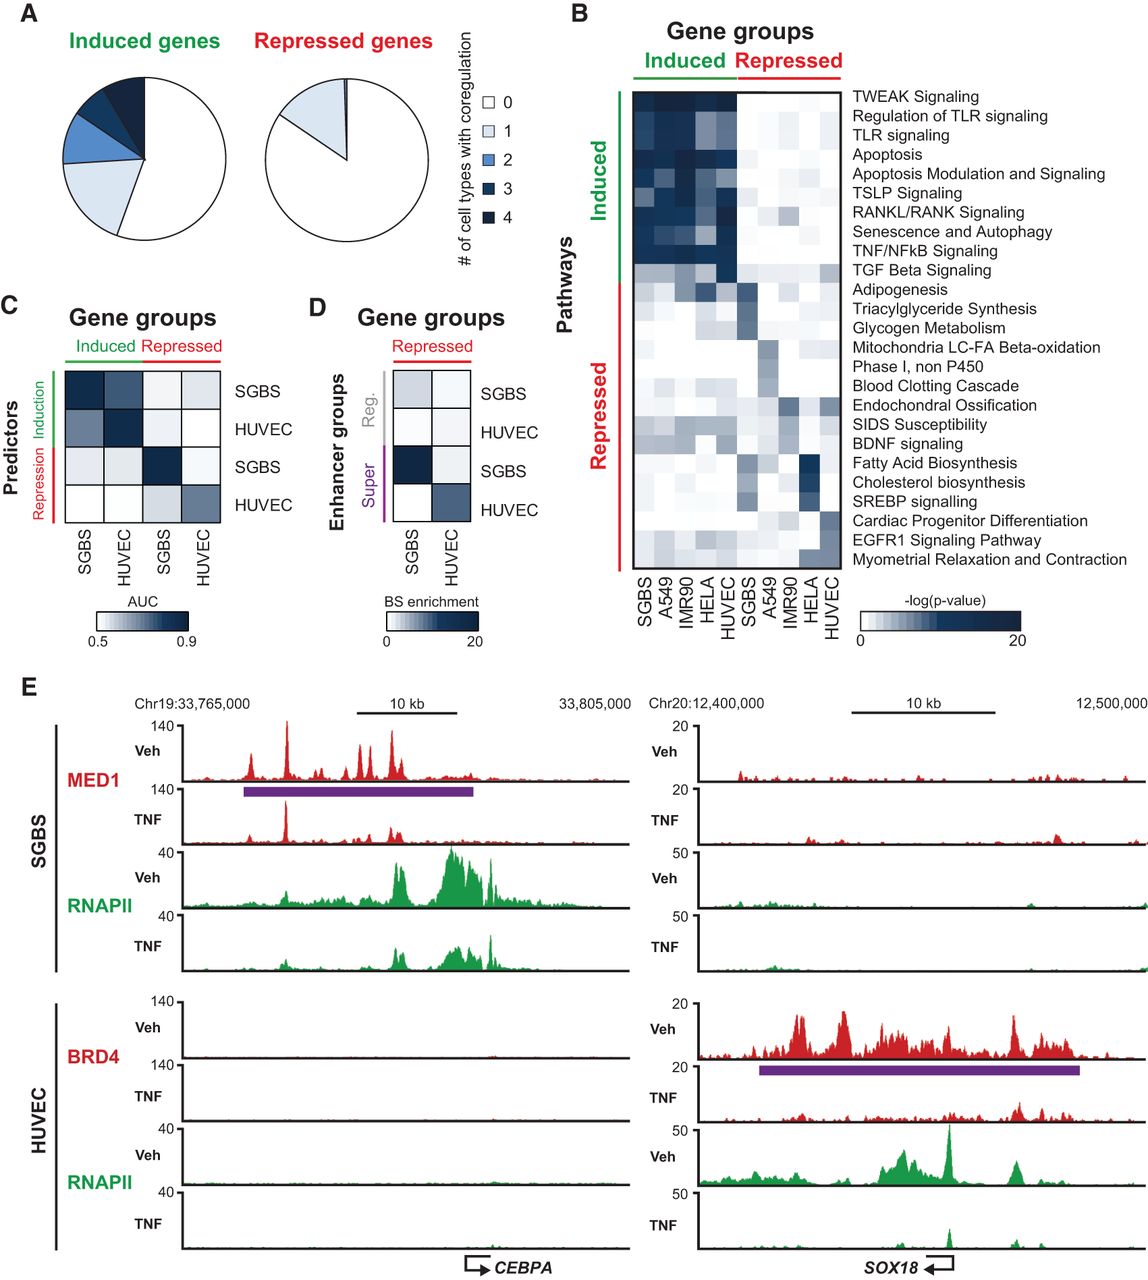
Gene repression by TNF is highly cell-type specific. (A,B) Publically available RNAPII ChIP-seq or total RNA-seq data from HUVEC, A549, IMR90, and HeLa cells treated with TNF or vehicle for 1 h were analyzed using iRNA-seq to assess ongoing transcription. The top 200/top 500 induced and repressed genes were identified based on the lowest P-value. (A) Pie chart representing the fraction of the top 200 genes induced (left) or repressed (right) by TNF treatment of SGBS adipocytes that are also among the top 200 induced and repressed genes in 1–4 additional cell types, respectively. P-value (Induced vs. Repressed): * = 1.06 × 10⁻¹⁴, Pearsons's χ2 test. (B) Heat map representing −log(P-values) for the top three enriched pathways for the top 500 genes induced and repressed by TNF in each cell type. Pathways among the top three enriched in more than one cell type are only represented once. (C,D) Publicly available BRD4 and RELA ChIP-seq data from HUVECs treated with TNF or vehicle for 1 h were analyzed using HOMER and compared with our SGBS data. (C) Heat map representing gene regulation by TNF in SGBS and HUVEC cell models based on RELA and cofactor occupancy. Induction models (green) are based on summarized distance-adjusted RELA occupancies as in Supplemental Figure S3E, and repression models (red) are based on summarized distance-adjusted occupancy scores as defined in Figure 3G and Supplemental Figure S6E. Models from both cell types were applied to predict the top 200 TNF-regulated genes in each cell type. (D) Heat map representing enrichment of regular enhancers and super-enhancers defined in SGBS and HUVEC cells within 20 kb of the TSS of genes repressed in either SGBS cells or HUVEC cells. Enrichment is relative to the number of sites within 20 kb of the TSS of constitutive genes (FDR/P > 0.9). (E) UCSC Genome Browser screenshots of RNAPII (green) and MED1 (red) occupancy at gene loci of two super-enhancer-associated genes, SOX18 and CEBPA, expressed and repressed by TNF in a cell-type–specific manner. The purple lines indicate the position of the super-enhancers.


