
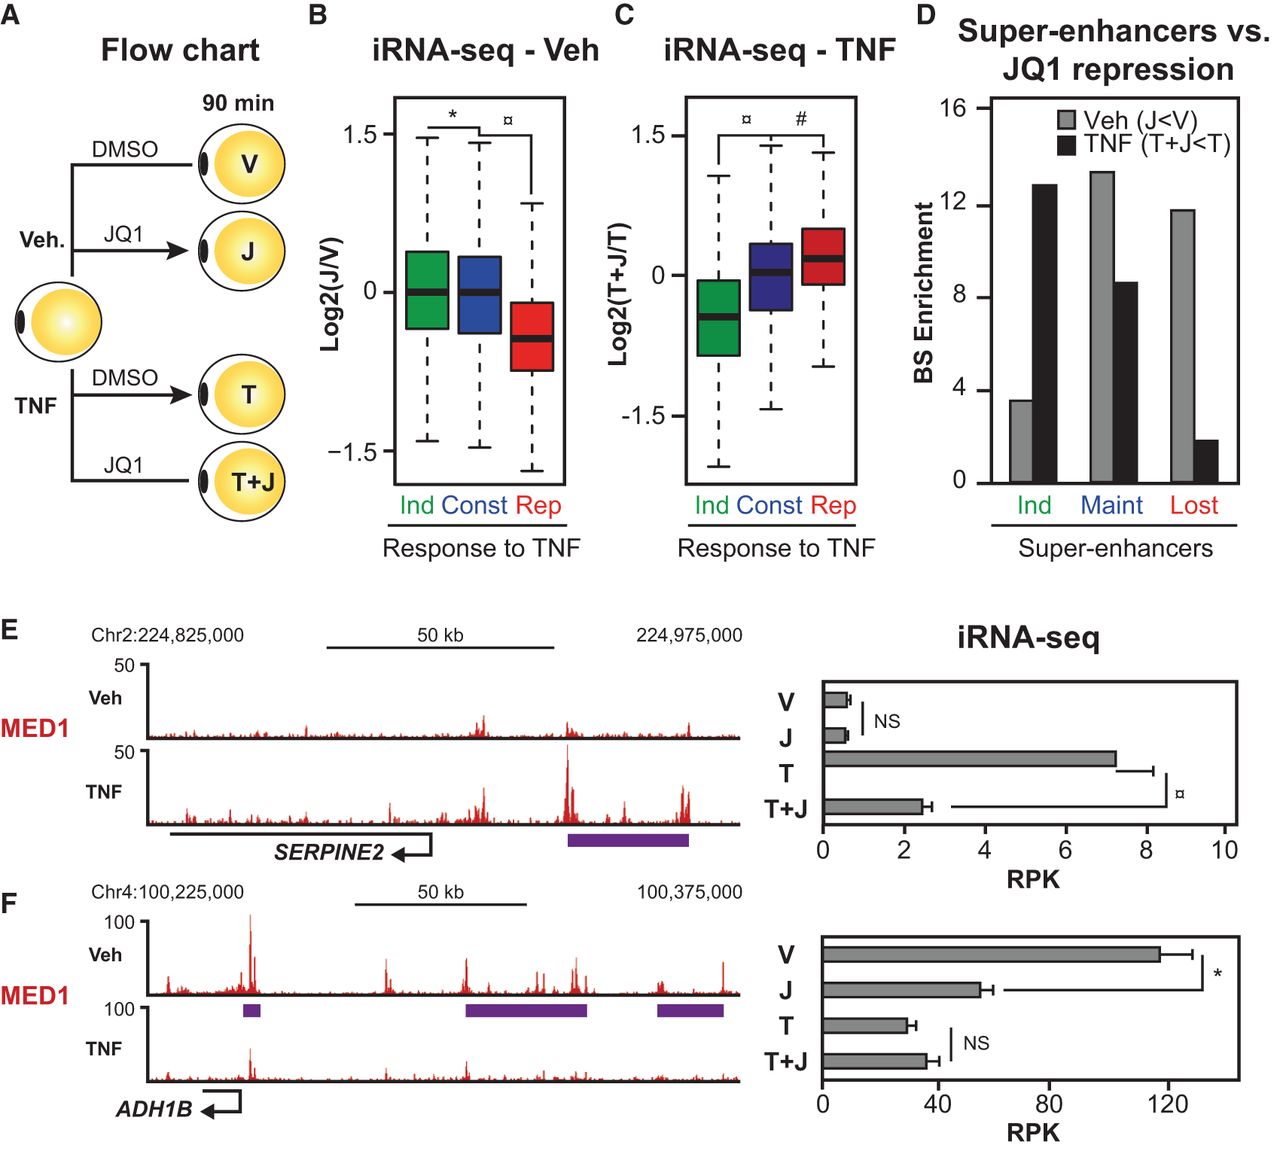
TNF-regulated genes are sensitive to repression by BRD4-inhibition. (A) Flow chart for treatment with JQ1. Human SGBS adipocytes were treated with vehicle or 10 ng/mL TNF in combination with DMSO or 500 nM JQ1 for 90 min before harvest of RNA for total RNA-seq. Changes in transcriptional activity were determined using the iRNA-seq pipeline. (B,C) Box plots illustrating log2 fold change in transcriptional activity following JQ1-treatment in vehicle- (B) and TNF-treated SGBS adipocytes (C). Green and red boxes represent genes that were determined to be induced and repressed, respectively, by TNF (V vs. T, FDR < 0.01). Blue boxes represent constitutive genes (FDR > 0.9; |log2FC < 0.2|). P-value: * < 2.2 × 10⁻¹⁶, ¤ = 7.10 × 10⁻⁴, # = 8.0 × 10⁻⁷, Wilcoxon rank-sum test. (D) Bar diagrams illustrating enrichment of super-enhancers that are induced, maintained, or lost (as defined in Fig. 4D) near genes repressed by JQ1 in vehicle- (V vs. J) or TNF-treated (T vs. T + J) adipocytes (FDR < 0.01). Enrichment was determined as the number of binding sites per gene within 20 kb of the TSS for repressed genes relative to the number of binding sites per constitutive gene. (FDR > 0.9; |log2FC| < 0.2). (E,F) (Left) UCSC Genome Browser screenshots of MED1 occupancy at gene loci of the gained super-enhancer-associated gene SERPINE2 (E) and the lost super-enhancer-associated gene ADH1B (F). The purple lines indicate position of super-enhancers. (Right) Bar diagrams illustrating transcription levels of SERPINE2 (E) and ADH1B (F) assessed as intron reads per kb per 10 M (RPK). FDR: * = 8.20 × 10⁻⁴, ¤ = 7.13 × 10⁻¹⁶, EdgeR.


