
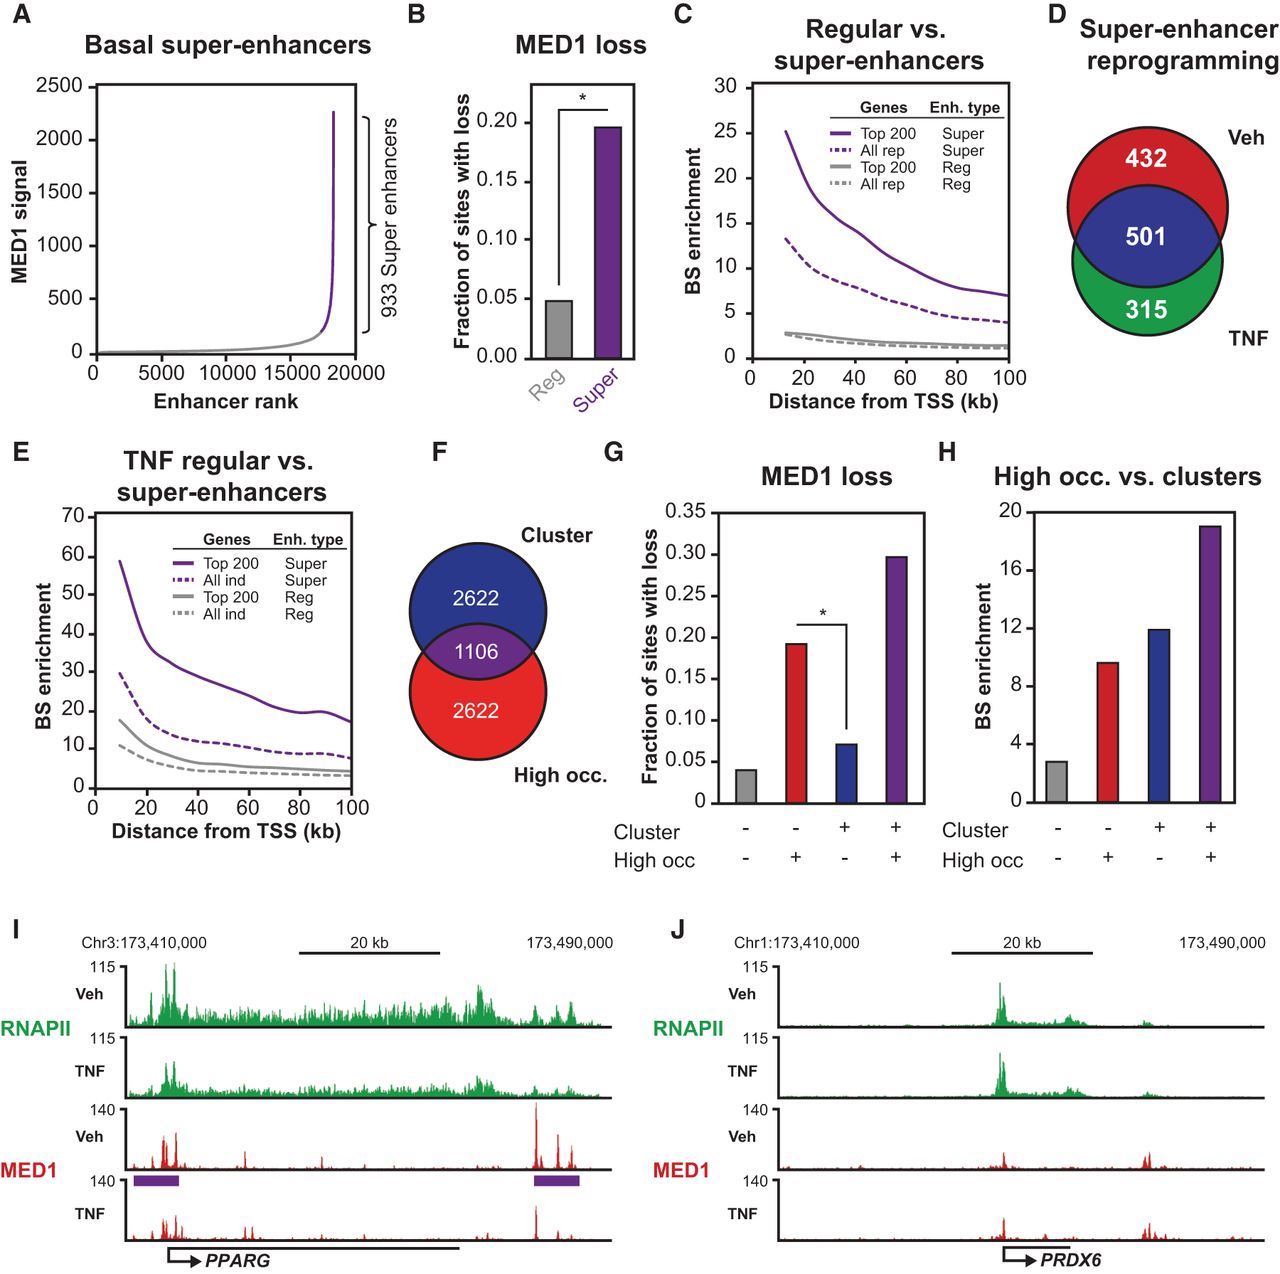
Adipocyte super-enhancers are sensitive to RELA-mediated MED1 redistribution. (A) Definition of basal super-enhancers. All identified MED1 (vehicle) binding sites (27,123) within 12.5 kb of each other were merged, resulting in 18,224 regions of which 933 were classified as super-enhancers in both MED1 replicates based on input-subtracted read counts. (B) Bar diagrams representing the fraction of basal regular and super-enhancer constituents with loss of MED1 in response to TNF exposure as defined in Figure 1D. P-value: * < 2.2 × 10⁻¹⁶, Pearson's χ2 test. (C) Enrichment of basal regular and super-enhancer constituents near TNF-repressed genes defined in Figure 1A. Enrichment was determined as the number of binding sites per gene within different distances from the TSS (10–100 kb) of repressed genes (top 200 and all repressed) relative to the number of binding sites per gene of constitutive genes. (D) Venn diagram representing the overlap between super-enhancers found in vehicle- and TNF-treated SGBS cells as defined in A and Supplemental Figure 4H, respectively. (E) Enrichment of TNF-activated enhancers (defined in Fig. 1D based on increase in MED1 occupancy) near TNF-induced genes defined in Figure 1A. TNF-activated enhancers are divided into two groups based on whether they overlap with a TNF-induced super-enhancer (defined in supplemental Fig. S4H) or not. (F) Venn diagram representing the overlap between enhancers defined as “cluster enhancers” based on their association with an enhancer cluster, or “high-occupancy enhancer” based on a high MED1 occupancy (defined in Supplemental Fig. S4K,L). (G) Bar diagrams representing the fraction of MED1 sites in the different groups defined in F that display loss of MED1 in response to TNF as defined in Figure 1D. P-value: * < 2.2 × 10⁻¹⁶, Pearson's χ2 test. (H) Enrichment of different types of MED1 sites defined in F near TNF-repressed genes defined in Figure 1A. Enrichment was determined as the number of binding sites per gene within 20 kb from the TSS relative to the number of binding sites per constitutive gene. (I,J) UCSC Genome Browser screenshots of RNAPII (green) and MED1 (red) occupancy at gene loci of a typical super-enhancer-associated gene repressed by TNF (PPARG) (I) and a regular enhancer-associated gene (PRDX6) not affected by TNF (J). The purple bars indicate the position of the super-enhancers.


