
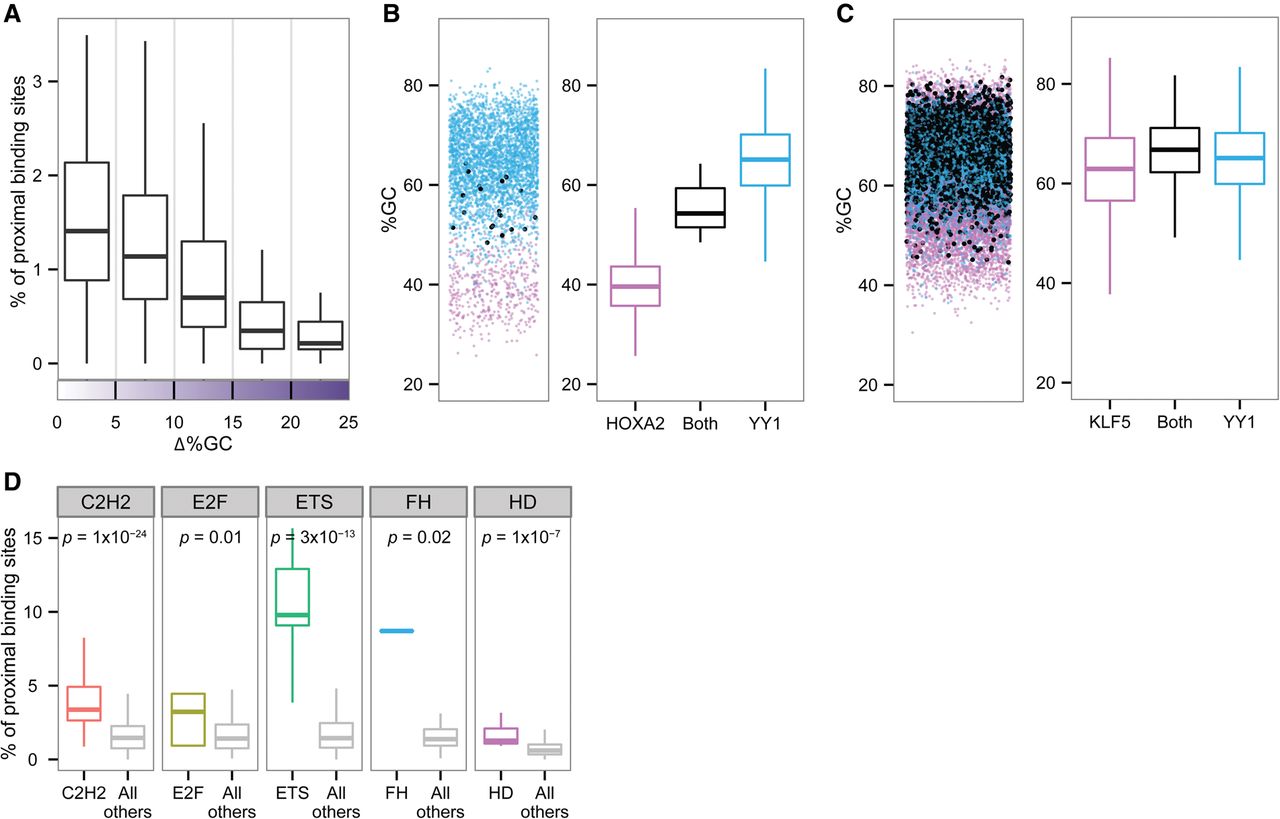
TF co-occupancy frequency. (A) Box plots representing the percentage of proximal binding sites relative to the differences in %GC of the motif environment. For each TF pair, the fraction in which one TF binding site occurs in close proximity to a binding site of another TF (y-axis) is plotted against the similarity or dissimilarity of the two TFs’ environmental preferences (x-axis). Close proximity is defined as 300 bp. (B, left) Jittered scatterplot showing GC content for each of the sequences bound by HOXA2 (pink), YY1 (blue), and both (black). (Right) Box plots representing the distribution of GC content for each of the sequences bound by HOXA2 (pink), YY1 (blue), and both (black). (C, left) Jittered scatterplot showing GC content for each of the sequences bound by KLF5 (pink), YY1 (blue), and both (black). (Right) Box plots representing the distribution of GC content for each of the sequences bound by KLF5 (pink), YY1 (blue), and both (black). (D) Box plots representing the percentage of proximal binding sites for each of the five TF families. The data were plotted separately for pairs of TFs from the same family and for pairs of TFs from different families. Wilcoxon test P-values indicate significant differences between the groups.


