
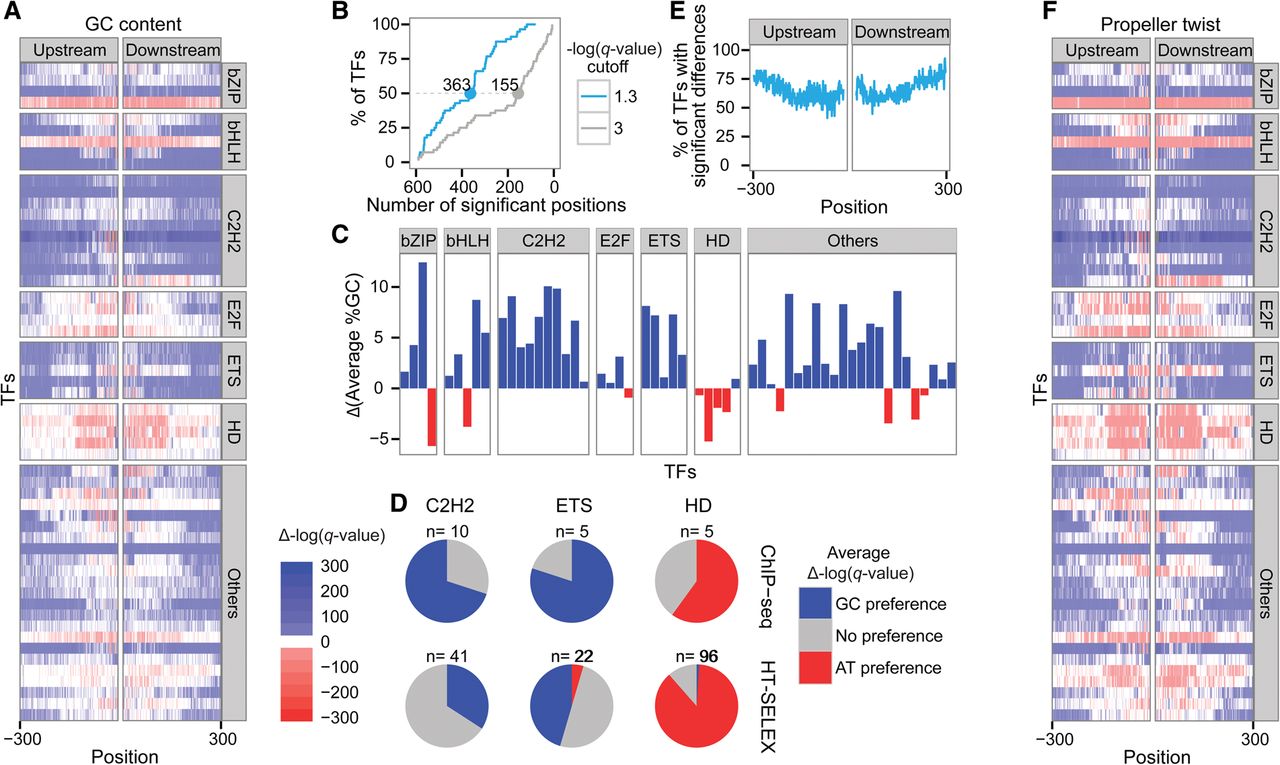
Differences in features of the regions surrounding TF motifs in bound and unbound sequences extracted from in vivo data. (A) Heat map representing the differences in GC content 300 bp upstream of and downstream from the core motifs: Red indicates positions at which the GC content was significantly lower in the bound motifs; blue, positions at which the GC content was significantly higher in the bound compared with the unbound motifs (the color intensity represents the significance). The TFs were grouped by the different TF families (HD for homeodomain). The positions correspond to the core-binding motif. (B) Cumulative plot representing the proportion of TFs as a function of the number of surrounding positions that differ significantly between the bound and unbound groups using two different thresholds to define significant differences: −log(q-value) ≥ 1.3 in blue and ≥3 in gray. (C) Differences between the average %GC of the bound and the unbound sequences: Red indicates TFs that prefer binding to regions with high AT content; blue, TFs that prefer binding to regions with high GC content. (D) Pie charts showing the number of TFs with significant nucleotide content differences for the three TF families shared between the in vitro (bottom) and in vivo (top) data. Blue represents GC preferences [Δ−log(q-value) ≥ 1.3]; gray, no significant preferences; and red, AT preferences [Δ−log(q-value) ≤ −1.3]. (E) Plot showing the percentage of TFs with significant nucleotide content differences [−log(q-value) ≥ 1.3] for each position 300 bp upstream of and downstream from the core motif. (F) Heat map representing the differences in propeller twist 300 bp upstream of and downstream from the core motifs: Red indicates positions at which the propeller twist was lower in the bound motifs; blue, positions at which the propeller twist was less pronounced in the bound compared with the unbound motifs (the color intensity represents the statistical significance). The TFs are grouped by the different TF families (HD for homeodomain). The positions correspond to the core-binding motif.


