
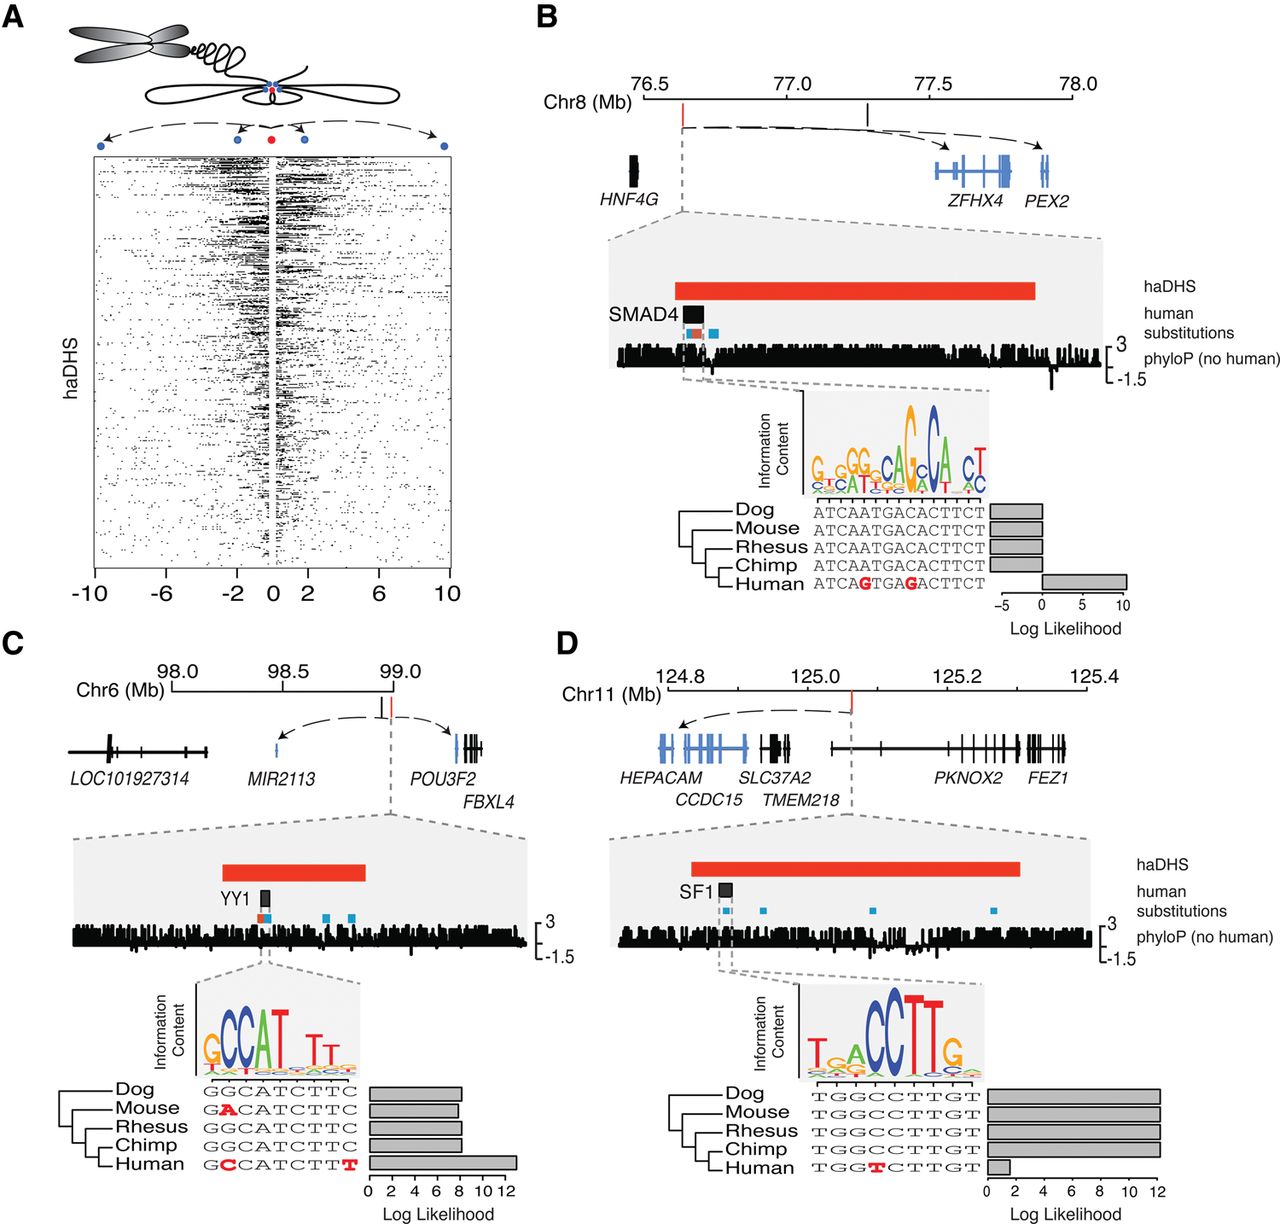
Hi-C chromatin conformation data identify putative regulatory targets of haDHSs. (A) Contacts are shown for all haDHSs, and each row indicates the contacts for one haDHS, which is in the center. Black boxes indicate one 40-kb contact region. The schematic above illustrates how chromatin conformation information gets translated into the Hi-C contact data. Blue dots represent contact regions; the red dot, an haDHS. (B–D) Three example haDHSs are shown with their surrounding genes and a predicted transcription factor binding site that is affected by a human-specific mutation(s). Genes that contact the haDHSs in Hi-C data are highlighted in blue, with arrows pointing to their transcription start sites. Examples B and C depict substitutions that create transcription factor binding sites, while D is a binding site that is predicted to be lost in humans. Human-specific substitutions that go from a weak to a strong base are shown in red, while all other substitutions are shown in blue. Bar plots, FIMO (Grant et al. 2011) log likelihood ratios of motif calls in each species.


