
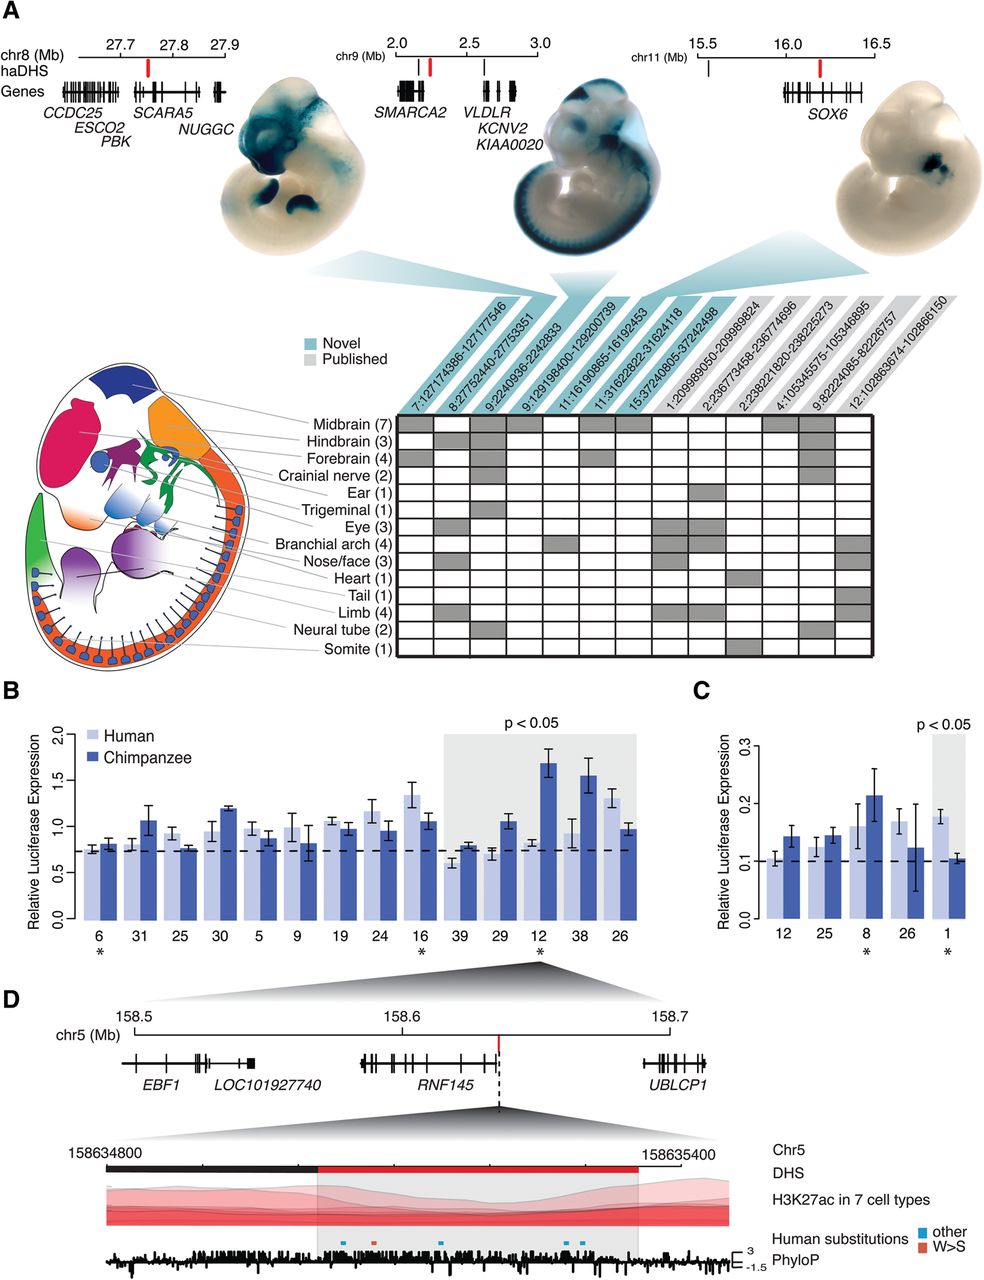
Experimental assays of enhancer activity in haDHSs. (A) A schematic of the transgenic mouse model is depicted. Rows in the table correspond to each embryonic region, and numbers in parentheses indicate how many of the haDHSs were positive in the region indicated. Columns represent the 13 haDHSs that showed enhancer activity, and gray boxes indicate what tissues the haDHS was active in. Three examples of positive assays are shown above, along with a schematic depicting their location relative to nearby genes. The haDHS tested is shown in red, and other haDHSs in the region are shown in black. (B,C) Results from luciferase assays for haDHSs that showed significant enhancer activity in SK-N-MC and IMR90 cells, respectively. Dotted lines indicate the mean relative expression from the negative controls, and the gray box indicates haDHS human and chimpanzee sequences that showed significantly different activity (P < 0.05). Bars, SE. Asterisks below each plot indicate haDHSs that were active in SK-N-MC or IMR90 (other haDHSs were active in similar cell types, such as fetal brain or NHLF). (D) A schematic of the region surrounding haDHS12, which had the largest difference in enhancer activity. The haDHS is located just upstream of the alternatively spliced gene RNF145. Red substitutions are weak to strong, and all other substitutions are colored in blue. PhyloP scores are also shown across the region. This DHS was partitioned prior to statistical testing into two distinct DHSs. The red portion is human accelerated, and the black portion is not.


