
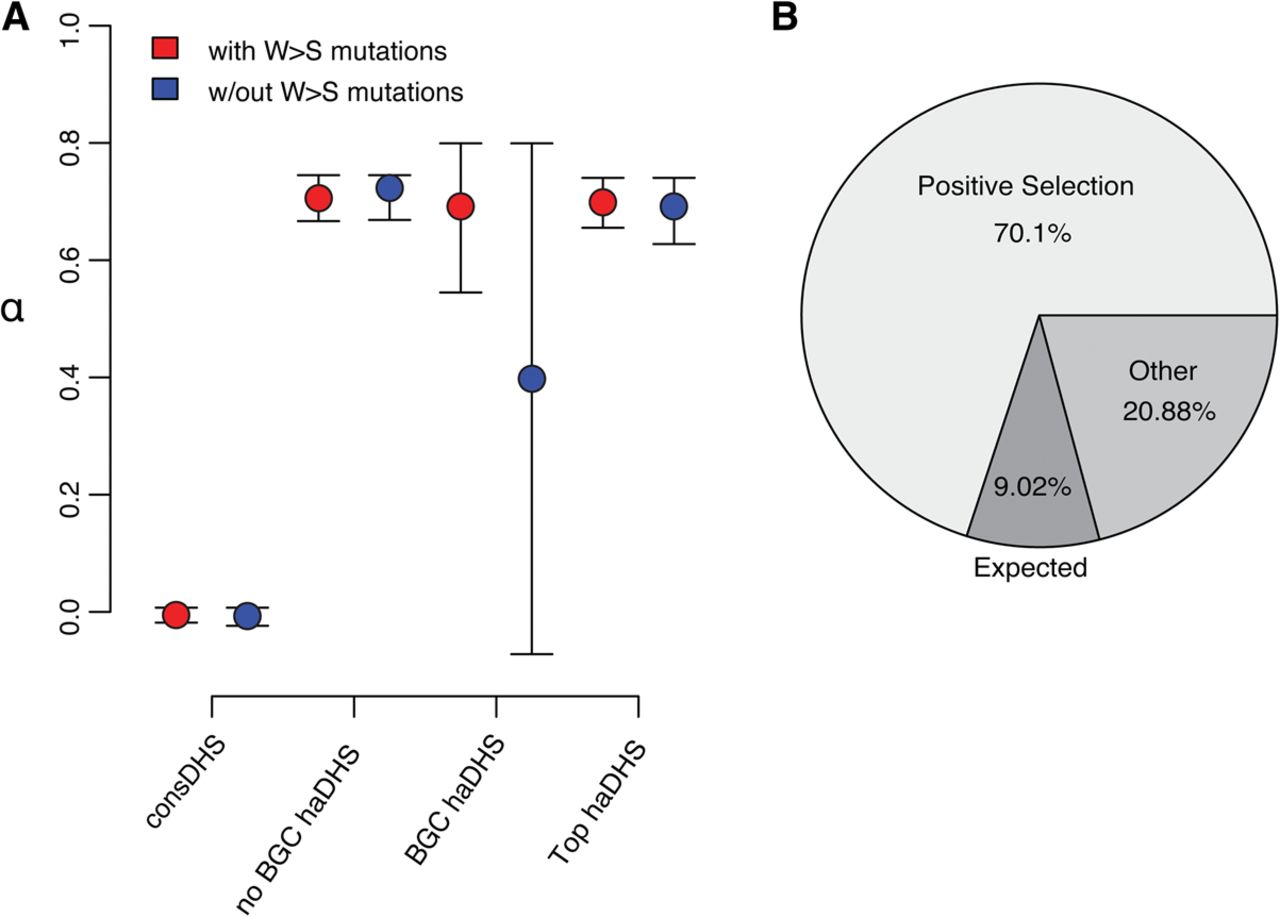
Figure 4.
Factors contributing to rate acceleration of haDHSs. (A) Estimates of the proportion of adaptive substitutions, α, and 95% bootstrap confidence intervals for different classes of haDHSs. Red and blue denote estimates that include or exclude weak to strong mutations, respectively. (B) Pie chart summarizing the proportion of substitutions in haDHSs inferred to be influenced by different factors. Expected indicates the proportion of substitutions assuming rates of evolution in the human lineage were the same as that in nonhuman primates; other, substitutions due to other factors such as relaxation of constraint or mutation rate heterogeneity.


