
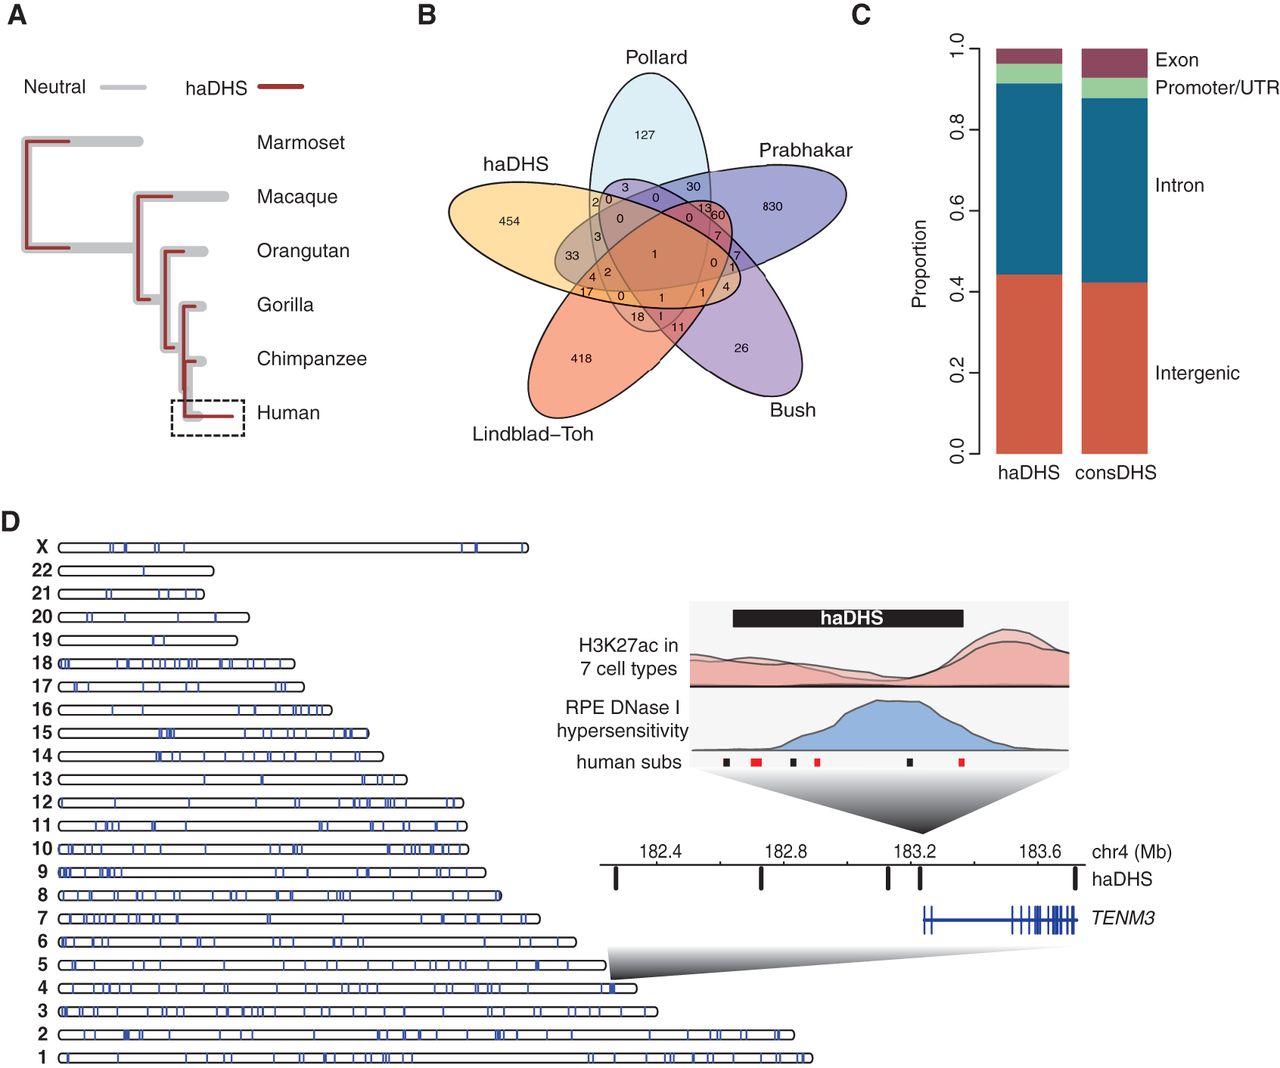
Characteristics of human-accelerated DHSs. (A) Overlaid phylogenetic trees inferred in haDHSs (maroon) versus their flanking neutral regions (gray). The human branch is highlighted by the dashed rectangle. (B) Venn diagram showing overlap of haDHSs with human accelerated elements (HAEs) identified in previous studies. (C) The proportion of bases in haDHSs and conserved DHSs that are located in different functional classes of genomic sequence. (D) Distribution of haDHSs across the genome. Each vertical bar on the chromosome ideogram represents an haDHS. (Inset) Plot shows a region on Chromosome 4 near the TENM3 gene that contains five haDHSs. The fourth haDHS is enlarged to show that it is accessible in retinal pigment epithelial cells (blue) and is flanked by an H3K27ac signal (pink). Human substitutions are shown in red (weak to strong) and black (all others).


