
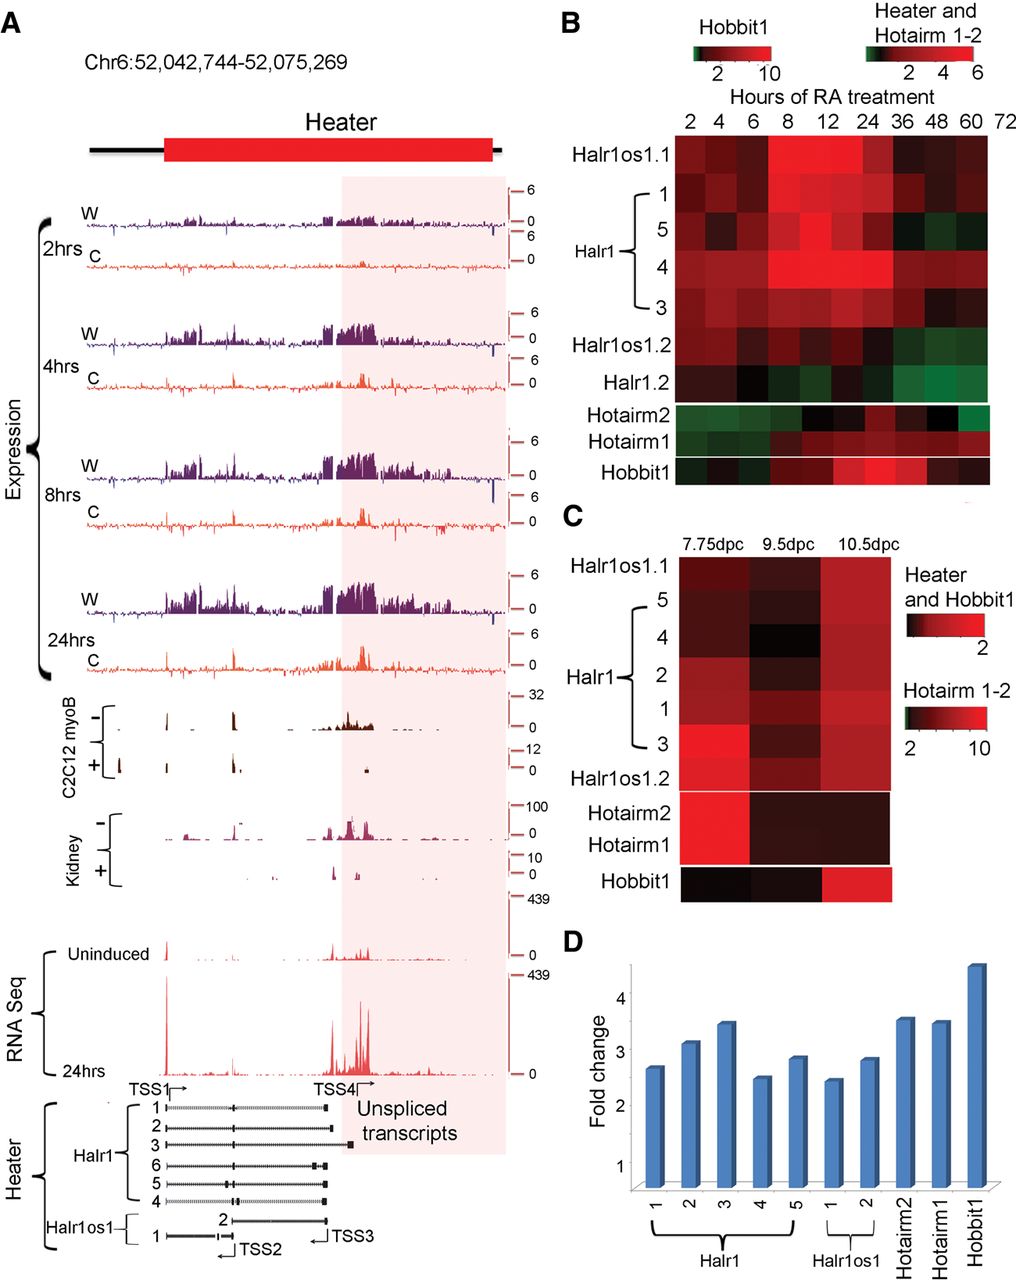
Characterization of Heater (HoxA EArly Transcribed REgion) transcripts. (A) Transcription from the Heater region analyzed by tilling arrays, RNA-seq, and ENCODE. The top of the panel shows rapid induction of Heater transcripts between 2 and 24 h of RA treatment detected by tiling array profiles. W and C represent Watson and Crick strands, respectively. In the middle of the panel is evidence of Heater expression in adult kidney and cultured cells based on ENCODE data. + and − indicate opposing strands. RNA-seq data in uninduced and 24-h RA-treated ES cells validate expression profiles observed in tiling arrays. At the bottom, multiple Heater transcripts, from Halr1 and Halr1os1, are shown schematically with the respective transcription start sites (TSS) and direction of transcription as indicated by arrows. The pink box denotes a region with a large number of unspliced transcripts generated from TSS4. (B) Heatmap of qPCR quantitation of Halr1, Halr1os1, Hotairm1, Hotairm2, and Hobbit1 transcripts in RA-induced ES cells. Levels of transcripts are compared against respective transcript levels in uninduced ES cells. Heater, Hotairm1, and Hotairm2 are induced at comparable levels, whereas Hobbit1 shows a higher level of induction in RA-induced differentiation. (C) Heatmap of qPCR quantitation of Halr1, Halr1os1, Hotairm1, Hotairm2, and Hobbit1 transcripts in developing mouse embryos. Levels of transcripts are compared against respective transcript levels in 10 dpc embryo. Heater and Hobbit1 are induced at comparable levels, whereas Hotairm1 and Hotairm2 show higher levels of induction during mouse embryonic development. Green represents down-regulation; red shows up-regulation. (D) Response of Halr1, Halr1os1, Hotairm1, Hotairm2, and Hobbit1 to RA in mouse embryos. The relative response to RA is calculated as fold change in transcript level after treating 10.0 dpc mouse embryos with RA compared to untreated mouse embryos at the same stage.


