
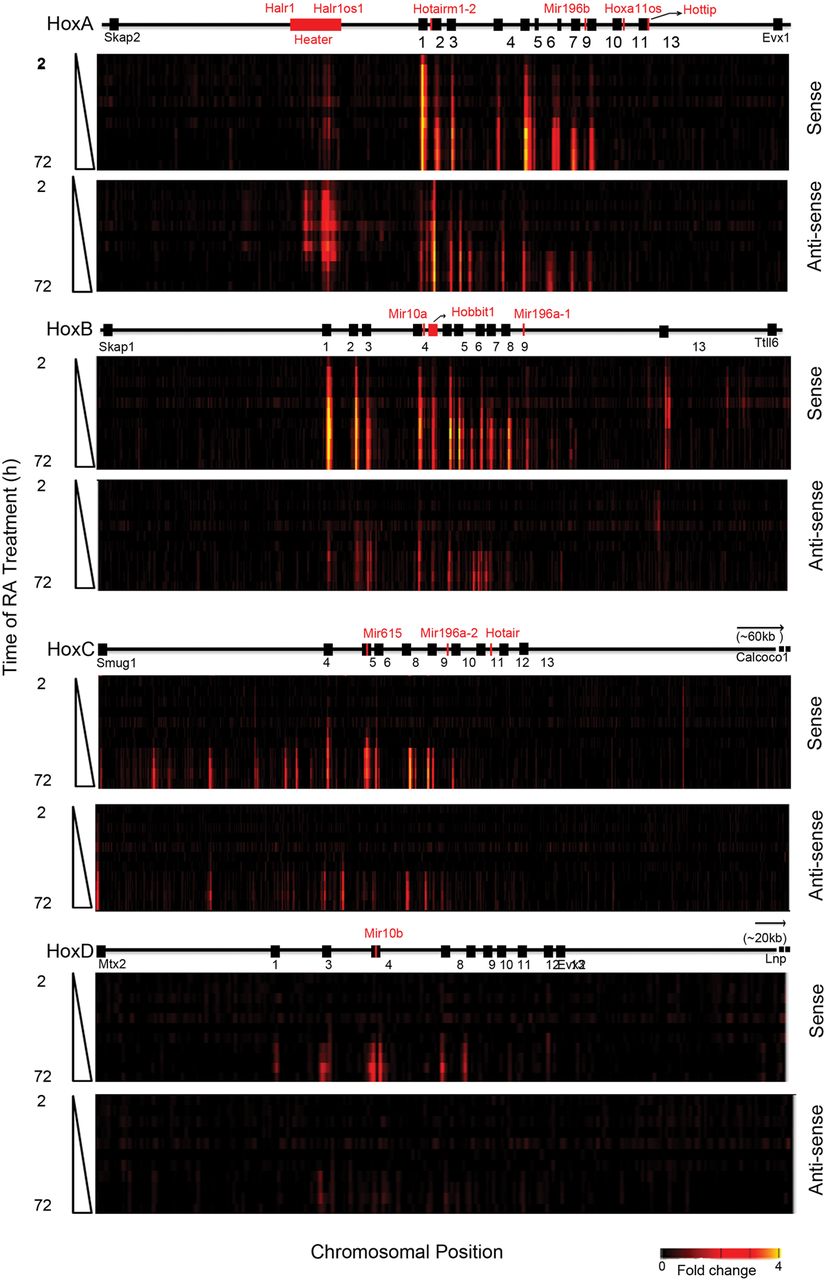
Figure 3.
Global transcriptional activity in and around the four Hox clusters analyzed by Agilent tiling arrays. Heatmap showing global changes in gene expression over the time course of RA induction compared with uninduced ES cells as analyzed on custom Agilent 2x10⁵K Hox tiling arrays. mRNA is labeled with Cy3. Heatmaps are generated on the Integrative Genomics Viewer (IGV) 1.5, where intensity of heat represents relative expression level. Upper and lower panels in each cluster represent sense and antisense strands, respectively. The x-axis denotes the chromosomal position and location of respective Hox genes and ncRNAs. The y-axis denotes the length of RA treatment in h.


